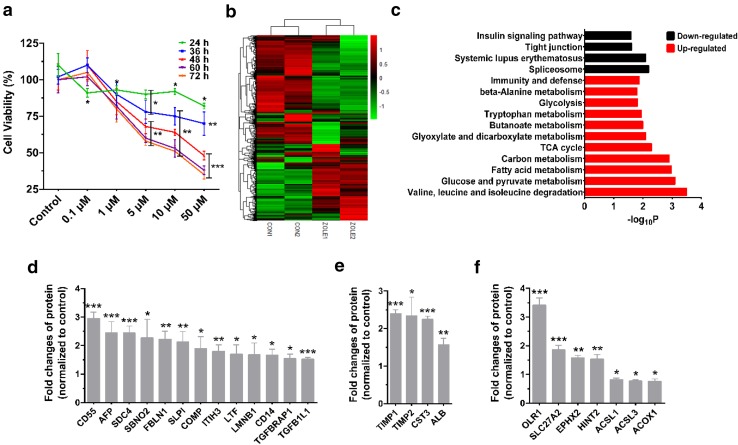
Fig. 1.
Analysis of proteomic data of HK-2 cells treated with or without zoledronate (50 µM) for 48 h. a Cell viability curves of HK-2 cell. HK-2 cell was treated by various doses of zoledronate (0, 0.1, 1, 5, 10, 50 µM) for 24, 36, 48, 60 and 72 h. b Heat map of significantly changed proteins following zoledronate treatment on HK-2 cells. c Gene ontology (GO) analysis of HK-2 cell treated with control and zoledronate samples. The graph shows the negative log p values for the enrichment of the specific pathways. d Relative protein levels related to TGFβ and inflammation. e Relative protein levels related to fibrosis and kidney injury. f Relative protein levels related to lipid and FA metabolism. Data presented as mean ± SD (each treated sample (n = 2) were compared with each untreated one (n = 2) once, resulting in four sets of data). Zole is the abbreviation of zoledronate in all the figures

