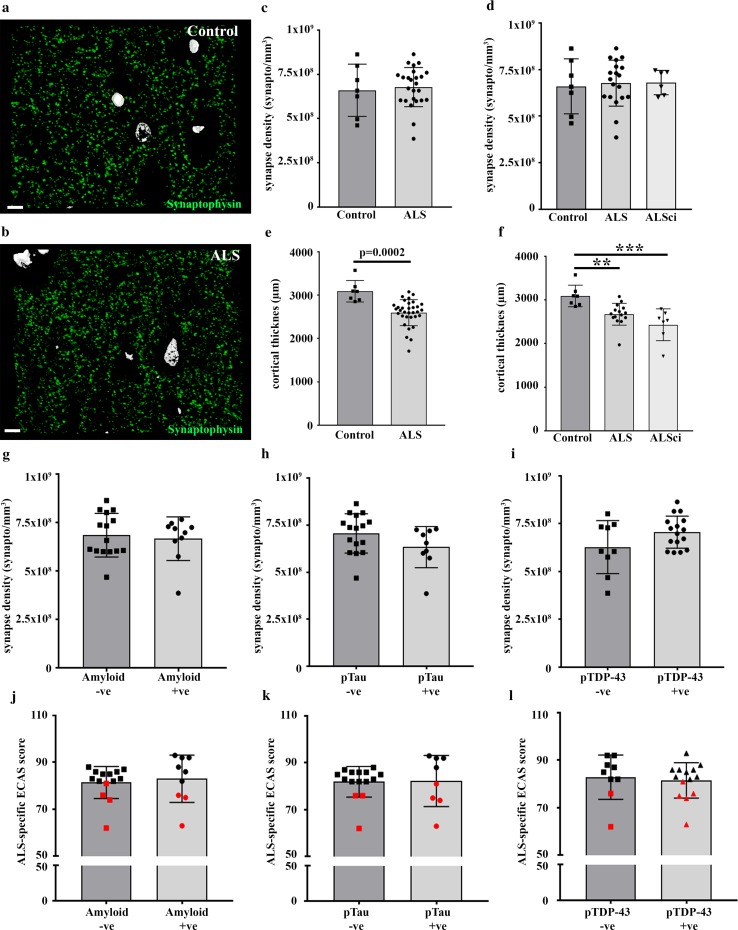
Fig. 3.
Synapse density in the ALS motor cortex does not associate with cognitive decline. Three-dimensional reconstruction of twenty-four 70 nm array tomography sections from a control motor cortex (a) and an ALS motor cortex (b), stained for synaptophysin (green) and DAPI (white). Scale bar is 10 µm. c Histogram showing no change in synaptic puncta within the motor cortex (2-tailed unpaired t test; p = 0.73) between control and ALS. Each data point represents the mean synapse count per mm3 of motor cortex, for each individual (control n = 7; ALS n = 25). d When split by cognitive status, there is no difference in synapse density within the motor cortex (One-Way ANOVA; F = 0.06, p = 0.94). e Histogram showing a significant decrease in the thickness of ALS motor cortex compared to controls (2-tailed unpaired t test; p = 0.0002). f Both ALS and ALSci motor cortices are significantly thinner than control (One-Way ANOVA; F = 9.98, p = 0.0006; Tukey post hoc test; p < 0.05 and p < 0.01, respectively). The presence of beta-amyloid (g), pTau (h) and pTDP-43 (i) in the motor cortex, had no effect on synapse density (2-tailed unpaired t tests; p > 0.05). The presence of beta-amyloid (j), pTau (k) and pTDP-43 (l) in the motor cortex, had no effect on cognitive score (2-tailed unpaired t tests; p > 0.05). Red icons = ALSci. All histogram bars plot the mean ± SD

