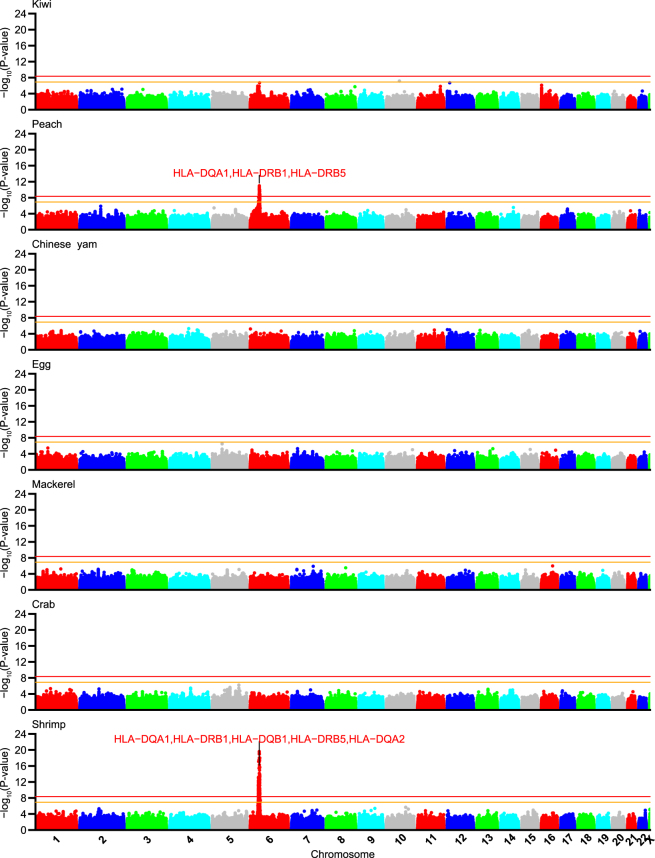
Figure 1.
Manhattan plots of meta-analysis P-values for food reactivity GWAS. Manhattan plots of −log10(Pmeta) for GWAS of self-reported food reactions to seven foods with >100 samples in both LL01 and LL02 sample-sets. Summary statistics based imputed meta-analysis data was filtered for MAF ≥ 0.01 and DISTMIX INFO > 0.8. Top shrimp and peach association peaks in the HLA region were labelled with up to five annotated genes from Supplementary Worksheet S1 for variants with r2 > 0.8 to the top SNP in peach (rs28359884) or shrimp (rs74995702).

