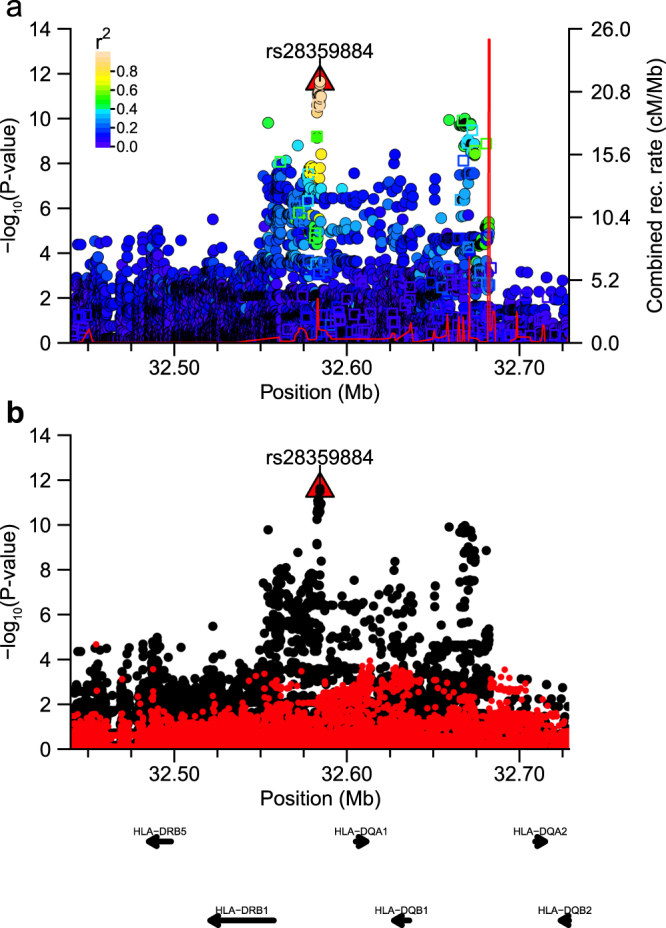
Figure 2.

Regional plot around peach association signal. Plot of association statistics around rs28359884. Panel (a) points coloured by LD r2 to the top SNP. Imputed variants were plotted as circles and genotyped data as squares. The red line shows the estimated recombination rate in 1000 G JPT samples. Panel (b) unadjusted statistics plotted as black dots and statistics after conditioning the logistic regression on rs28359884 plotted as red dots.
