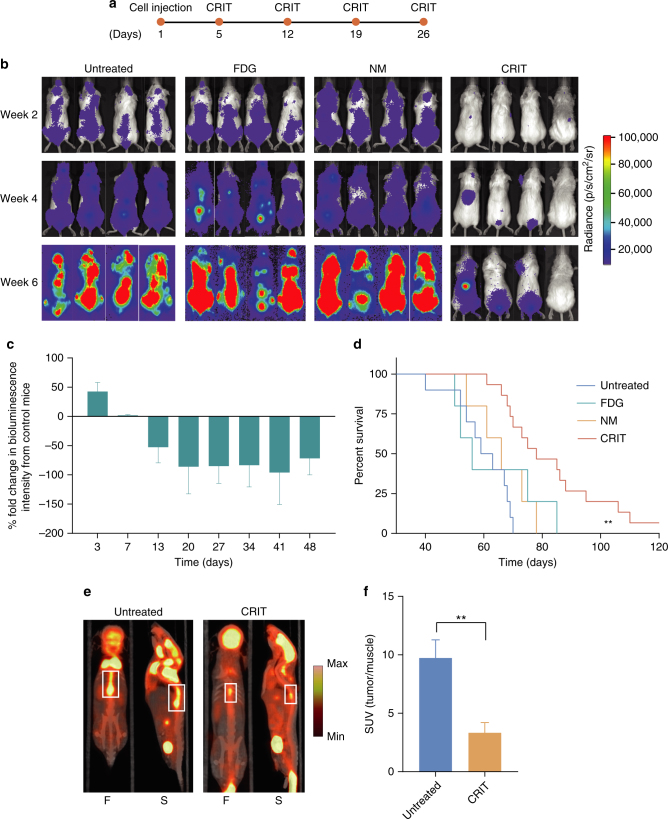
Fig. 3.
Response of multiple myeloma to CRIT. a Timeline of treatment. b Bioluminescence imaging of representative multiple myeloma-bearing mice in different treatment groups—untreated, 18FDG, NM controls and CRIT. All images are dorsal images and on the same scale. The images of control groups appear saturated on week 6 in comparison to CRIT. c Change in bioluminescence intensity as a result of treatment compared to untreated control. The intensity consistently remains lower than untreated controls during the treatment and beyond. d Comparison of survival of different treatment groups showing a twofold increase in survival in treated mice compared to control groups. **P < 0.01. e 18FDG-PET images of MM mice before and after treatment showing lower tumour burden in the latter. F: frontal view, S: sagittal view. Boxes denote tumour region. f SUV values of the treatment group were lower than untreated controls. **P < 0.01. n = 15 mice for CRIT, n = 10 mice for untreated control and n = 5 mice for NM-TC alone and 18FDG alone treated mice

