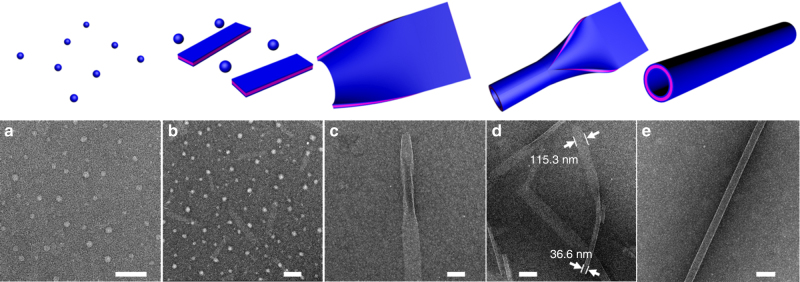
Fig. 2.
Time-dependent TEM images showing the assembly pathway of APO2-PNTs. a TEM image of APO2 nanospheres (~26.2 nm in diameter), which were formed immediately after APO2 was completely dissolved in the mixture of H2O and CH3CN (scale bar, 200 nm). b TEM image showing APO2 assembled into a mixture of nanospheres (~44.9 nm in diameter) and nanoribbons (with a width of 75–120 nm and length of 200–600 nm) after 0.5 h crystallization (scale bar, 200 nm). c TEM image showing one nanoribbon with partially rolled up edges after 24 h crystallization of APO2 (scale bar, 100 nm). d TEM image shows that APO2 formed partially converted nanotubes after 48 h crystallization (scale bar, 200 nm); the measured width of one nanoribbon (about 115.3 nm) is 3.15 (approximately equal to π) times the diameter of this closed nanotube (about 36.6 nm), which is in accordance with the circumference formula (L = πD). e TEM image showing the APO2-PNT formed after 72 h crystallization (scale bar, 100 nm)

