Fig. 3.
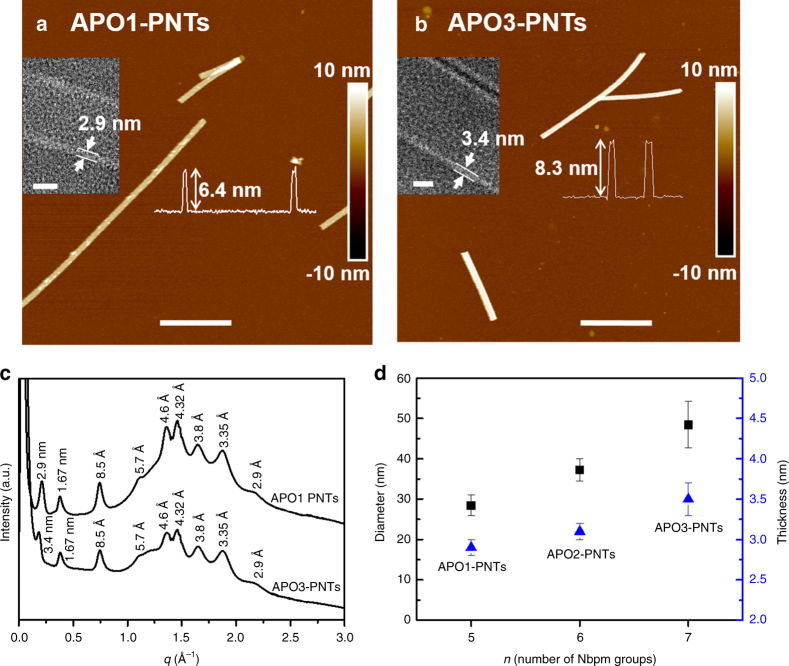
Tunability of PNT wall thickness and diameter. a AFM height image of APO1-PNT (scale bar, 500 nm); the left inset is the high-resolution TEM image of one APO1-PNT showing the PNT wall thickness (scale bar, 10 nm) and the right inset is the AFM height measurement showing the PNT height. b AFM height image of APO3-PNT (scale bar, 800 nm); the left inset is the high-resolution TEM image of one APO3-PNT showing the PNT wall thickness (scale bar, 10 nm) and the right inset is the AFM height measurement showing the PNT height. c XRD spectra of APO1-PNTs and APO3-PNTs, showing both APO1-PNT and APO3-PNT have similar structures. d PNTs wall thickness and diameter tuned by varying the number (n) of Nbpm side chains of APOs; Each value represents the mean standard deviation obtained from measuring at least 50 PNTs

