Fig. 4.
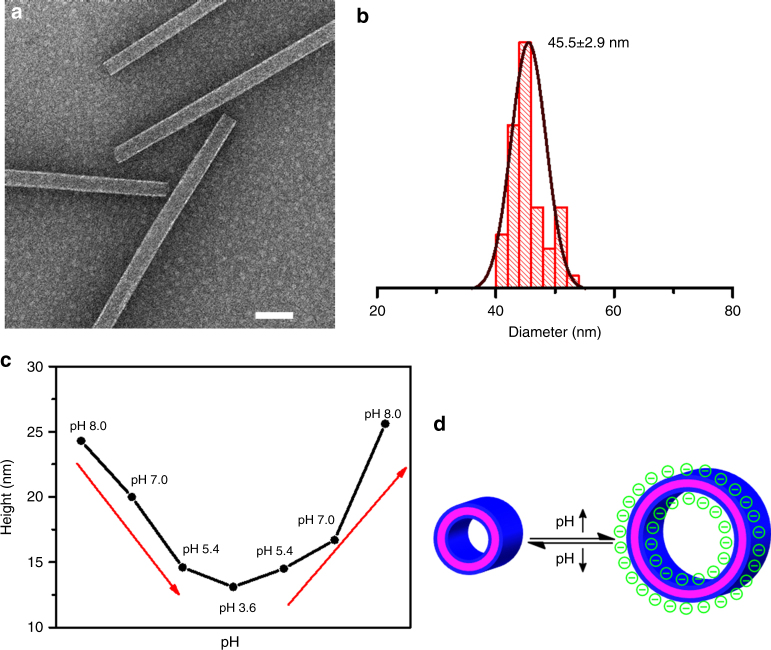
pH-responsive structural dynamics of APO2-PNTs. a TEM image of APO2-PNTs dispersed in pH 11.94 aqueous solution for 6 h (scale bar, 100 nm). b Statistical diameter distribution of pH-triggered APO2-PNTs measured from the TEM results. The number above histogram is the average tubular diameter; 50 nanotubes were analyzed for each size distribution. c The AFM height change of one fixed APO2-PNT in response to the solution pH variation. In the experiments, PNTs have been incubated with various aqueous solutions with different pH values (8.0, 7.0, 5.4, 3.6). The whole process was monitored in real time using in situ AFM. d A scheme showing the proposed mechanism of pH-triggered PNT height changes as a result of deprotonation of Nce groups

