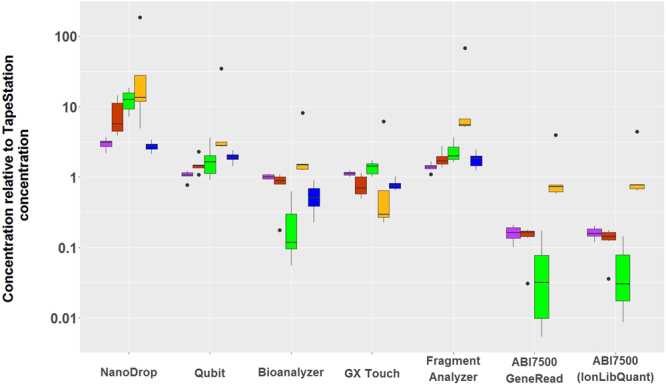
Figure 1.

Relative concentration estimates obtained using eight quantification methods. All quantifications were performed in duplicates. The mean was normalised by dividing with the mean of the concentration estimate obtained with the TapeStation instrument. Among the 18 Precision ID Identity Panel libraries, six were categorised as “well PCR amplified” (purple boxplots), six as “adapter dimer rich” (red boxplots), and six as “PCR inhibited” (green boxplots). Ion Xpress fragment libraries and NimbleGen capture libraries are shown in yellow and blue plots, respectively. The NimbleGen capture libraries were not quantified by qPCR, since the qPCR assays targeted Ion Torrent adapters. The lower and upper limits of the box correspond to the 0.25 and the 0.75 quartiles, respectively, and the median is indicated as a line within the box. The ends of the whiskers correspond to the most extreme data point within 1.5 times the interquartile range from the ends of the box. Outliers are indicated by dots.
