Figure 5.

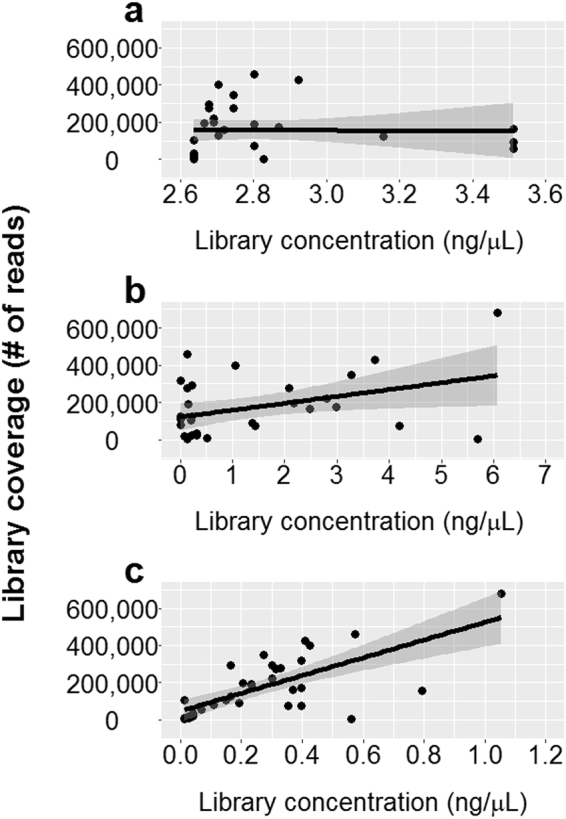
Correlations between library concentration estimates and library coverage. A total of 35 Precision ID Ancestry Panel libraries were quantified prior to sequencing using the Qubit (a), TapeStation (b), or ABI7500 qPCR (c) instrument. The ABI7500 was used in combination with the IonLibQuant assay. Linear regression lines (black line) are plotted with 95% confidence interval (grey area). No correlation was observed between concentration estimates and coverage when using Qubit (R2 = 7.4*10−2, p = 0.114) or TapeStation (R2 = 6.7*10−3, p = 0.651), while the correlation obtained with qPCR was R2 = 0.49 and p = 2.53*10−6.
