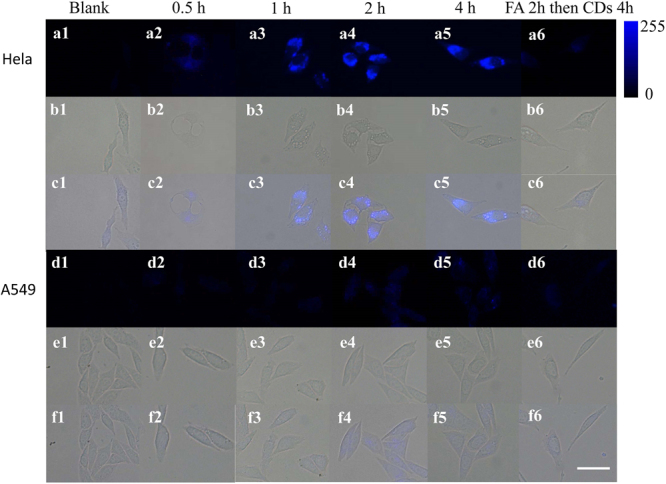
Figure 4.

Fluorescence images of Hela and A549 incubated with the FA derived CDs (100 μg/mL) at 37 °C for different incubated time, 0 h (a1,d1), 0.5 h (a2,d2), 1 h (a3,d3), 2 h (a4,d4), and 4 h (a5,d5). As another control, Hela and A549 pre-treated at 37 °C for 2 h with excess FA for FR saturation, and then incubated with CDs (100 μg/mL) at 37 °C for 4 h (a6,d6). Bright field images are shown in b and e. The overlay images are shown in c and f. Scale bar: 10 μm.
