Figure 1.
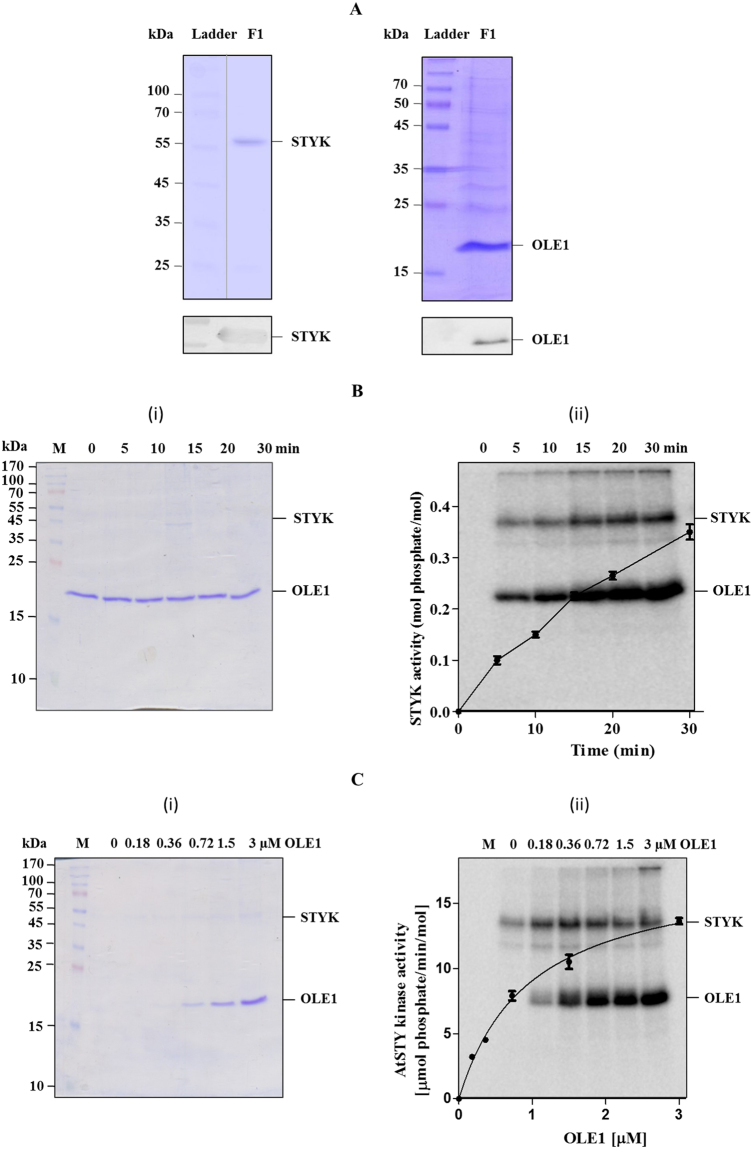
STY protein kinase phosphorylates OLE1. (A) SDS-PAGE profile of bacterially expressed, affinity column purified STYK and OLE1 (left and right panel respectively). Lower panels, confirmation of STYK and OLE1 proteins using anti-STYK and anti-His6 monoclonal antibody respectively. In vitro phosphorylation of the purified, bacterially expressed OLE1 by STYK. (B) time- and C, protein-dependent phosphorylation. After the reaction, the mixture was resolved on a 15% SDS-PAGE and stained with (i) Coomassie brilliant blue followed by (ii) phosphorimaging. Inset shows the radioactivity quantification from bands excised from gels determined by liquid scintillation counting. Data represent mean ( ± SD) of three independent experiments. F1, purified protein fraction.

