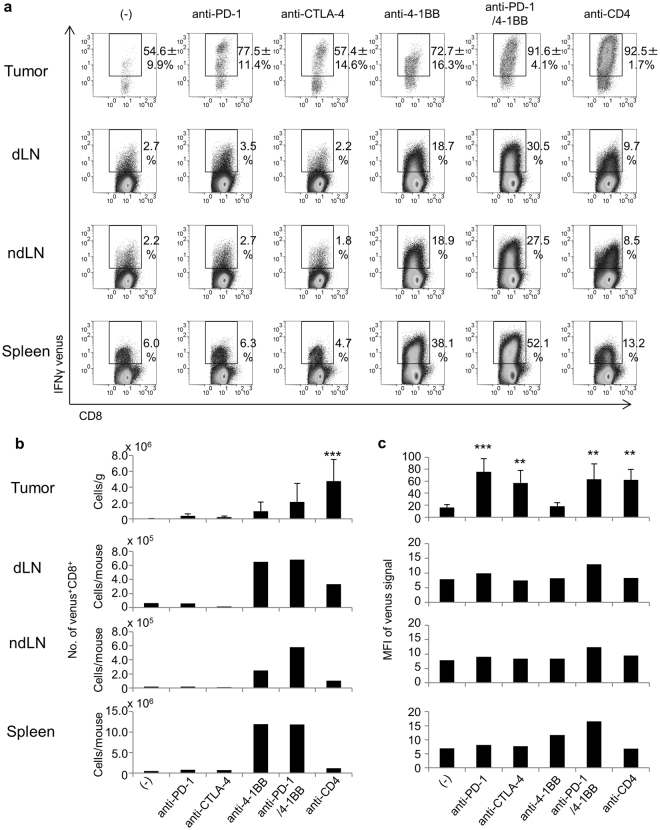
Figure 3.
Activation of CD8+ T-cells by immunotherapies. (a) Mice were treated as described in the legend to Fig. 1. Mice (n = 5) were killed on day 14 and the IFNγ venus signal from CD8+ T-cells in the tumor, draining lymph node (dLN), non-draining lymph node (ndLN) and spleen was analyzed by flow cytometry. The number on each panel indicates the mean ± SD of the percentage of venus+ cells among CD8+ T-cells of 5 mice. (b) The absolute numbers of venus+ CD8+ T-cells and (c) mean fluorescent intensities (MFI) of venus signals of these cells were compared. Steel’s test was used for multiple comparisons between control and treatment groups (a). Dunnett’s test was used for multiple comparisons between control and treatment groups (b,c). **p < 0.01, ***p < 0.001.

