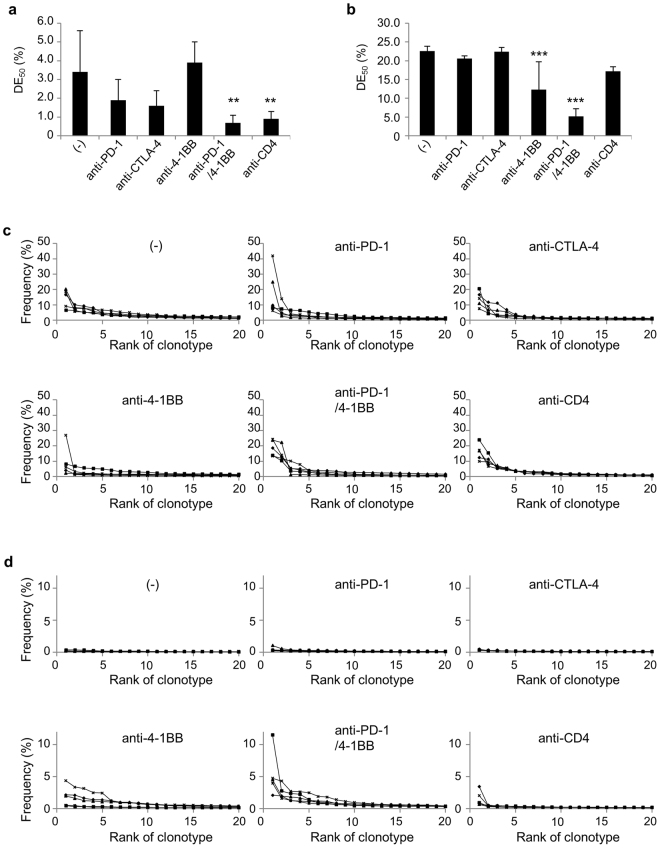
Figure 6.
Evenness of TRB CDR3 clonotype distribution. Mice were treated as described in the legend to Fig. 4. Groups of mice (n = 5) were killed on day 14 and TCRβ sequencing was performed. Diversity Evenness 50 (DE50) scores of the tumor (a) and the spleen (b) in each indicated treatment were calculated by DE50 = (the number of unique reads that consist of 50% of total read count)/(the total unique read count). All unique CDR3 sequences detected in the tumor (c) and the spleen (d) in each indicated treatment group sorted according to their frequency within the sample, showing that larger clones (left) dominate in the tumor of mice receiving immunotherapies. In mice that received anti-4-1BB mAb, highly enriched T-cell clones were also detected in the spleen. Solid lines indicate each individual mouse. Dunnett’s test was used for multiple comparisons between control and treatment groups. **p < 0.01, ***p < 0.001.

