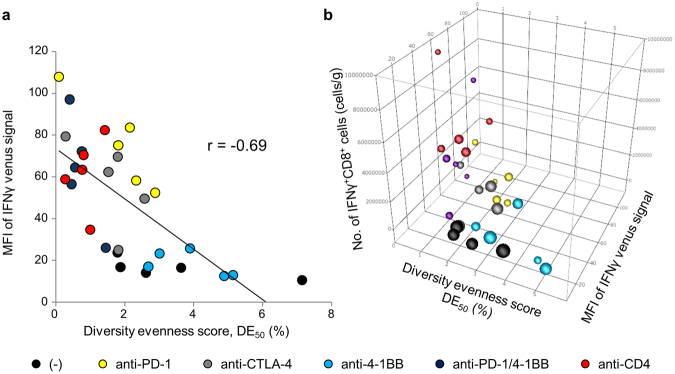
Figure 7.
Correlation between TRB CDR3 clonotype diversity in the tumor, T-cell effector function and anti-tumor activities. (a) Diversity Evenness 50 (DE50) scores on the x-axis versus MFI values of IFNγ venus signal on the y-axis. Each dot indicates individual mice receiving no treatment (black circles), anti-PD-1(yellow), anti-CTLA-4 (grey), anti-4-1BB (blue), combination of anti-PD-1 and 4-1BB (purple) or anti-CD4 mAb (red). (b) Relationship between Diversity Evenness 50 (DE50) scores, MFI values of IFNγ venus signal, the number of IFNγ+CD8+ cells in the tumor (cells/gram) and the tumor volume. The size of the circle indicates the tumor volume.

