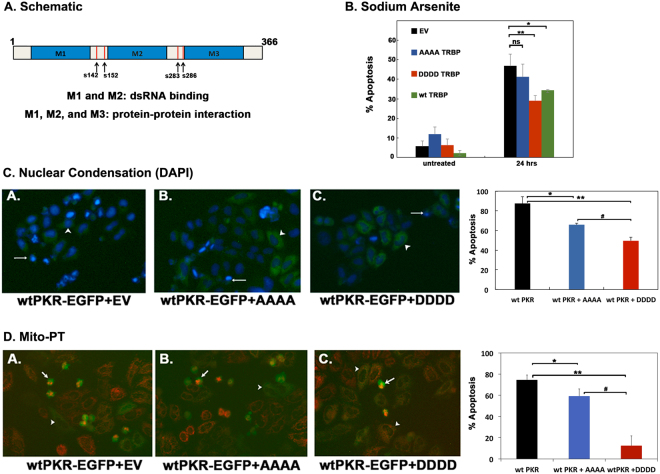
Figure 3.
TRBP phosphorylation inhibits PKR-mediated apoptosis during cell stress. (A) Schematic representation of TRBP phosphorylation sites. Blue boxes represent the three double-stranded RNA binding motifs (dsRBMs), M1, M2, and M3. Red vertical lines represent previously identified ERK 1/2 phosphorylation sites at S142, S152, S283, and S286. (B) Expression of phospho-mimic TRBP protects cells during oxidative stress. HeLa cells were transfected with 200 ng pEGFPC1 (EV) alone (black bars) or with 200 ng each of pEGFPC1 and Flag TRBP AAAA/pcDNA 3.1− (blue bars), 200 ng each of pEGFPC1 and Flag TRBP DDDD/pcDNA 3.1− (red bars) or 200 ng each of pEGFPC1 and Flag wt TRBP/pcDNA 3.1− (green bars). 24 hours after transfection, the cells were treated with 25 μM sodium arsenite, fixed and stained with DAPI nuclear stain. At least 300 EGFP-positive cells were scored as apoptotic or live based on nuclear condensation indicated by intense DAPI nuclear staining and cell morphology. The percentage of cells undergoing apoptosis (% apoptosis) was calculated using the formula: (EGFP- expressing cells with intense DAPI nuclear staining/Total EGFP-expressing cells) x 100. Bars represent averages ± S.D. from three independent experiments. One-way ANOVA followed by post-hoc Tukey test was performed, ns: not significant, asterisk *p value of 0.043. asterisk **p value of 0.007. (C) and (D) Phospho-mimic TRBP inhibits PKR mediated apoptosis more efficiently than phospho-defective TRBP (C) HeLa cells were plated on coverslips and transfected with 500 ng of wt PKR/pEGFPC1 and 20 ng of empty vector pCDNA3.1− (wt PKR; black bar) or with 500 ng of wt PKR/pEGFPC1 + 20 ng of Flag TRBP AAAA/pcDNA 3.1− (blue bar) or 500 ng of wt PKR/pEGFPC1 + 20 ng of Flag TRBP DDDD/ pcDNA 3.1− (red bar). 24 hours after transfection, the cells were fixed and mounted in Vectashield mounting media with DAPI nuclear stain. Representative fluorescent micrographs of HeLa cells transfected with wt PKR pEGFPC1 alone (Panel A), or in combination with Flag TRBP AAAA/pcDNA 3.1− (Panel B) or Flag TRBP DDDD/pcDNA 3.1− (Panel C) are shown. At least 500 EGFP-PKR expressing cells showing green fluorescence were scored as apoptotic (white arrows) or live (white arrowheads) based on nuclear condensation indicated by intense DAPI staining and cellular morphology. The cells showing intense DAPI staining and rounded morphology were scored as apoptotic. The percentage of cells undergoing apoptosis was determined as described in (A). Bars represent averages ± S.D. from three independent experiments. One-way ANOVA followed by post-hoc Tukey test was performed, asterisk *p value 0.0034, double asterisk **p value 0.0002, #p value 0.0134. (D) Phospho-mimic TRBP expression abrogates mitochondrial depolarization during PKR-mediated apoptosis. HeLa cells were plated on coverslips and transfected with 500 ng of wt PKR/pEGFPC1 and 20 ng of empty vector pCDNA3.1− (wt PKR; black bar) or with 500 ng of wt PKR/pEGFPC1 + 20 ng of Flag TRBP AAAA/pcDNA 3.1− (blue bar) or 500 ng of wt PKR/pEGFPC1 + 20 ng of Flag TRBP DDDD/ pcDNA 3.1− (red bar). 24 hours after transfection, changes in the mitochondrial potential of transfected cells were assessed using the MitoPT TMRM Assay kit and observed by fluorescence microscopy. Representative fluorescent micrographs of the cells transfected with wt-PKR pEGFPC1 alone (wt-PKR-EGFP + EV, Panel A), and AAAA TRBP (wt-PKR-EGFP + AAAA, Panel B) or DDDD TRBP (wt-PKR-EGFP + DDDD, Panel C) are represented. At least 500 PKR expressing cells (GFP positive, green fluorescent cells) were scored as live (white arrowheads) or dead (white arrows) based on decreased or absent red fluorescence. The PKR expressing, green fluorescent cells that showed diminished or no MitoPT staining (red fluorescence) were counted as apoptotic and the green fluorescent cells that showed good MitoPT staining (red fluorescence) were counted as live. The percentage of cells undergoing apoptosis (% apoptosis) was calculated using the formula: (EGFP- expressing cells with decreased or absent red fluorescence/Total EGFP-expressing cells) x 100. Bars represent averages ± S.D. from three independent experiments. One-way ANOVA followed by post-hoc Tukey test was performed, asterisk *p value 0.0108, double asterisk **p value 0.0003, #p value 0.0002.

