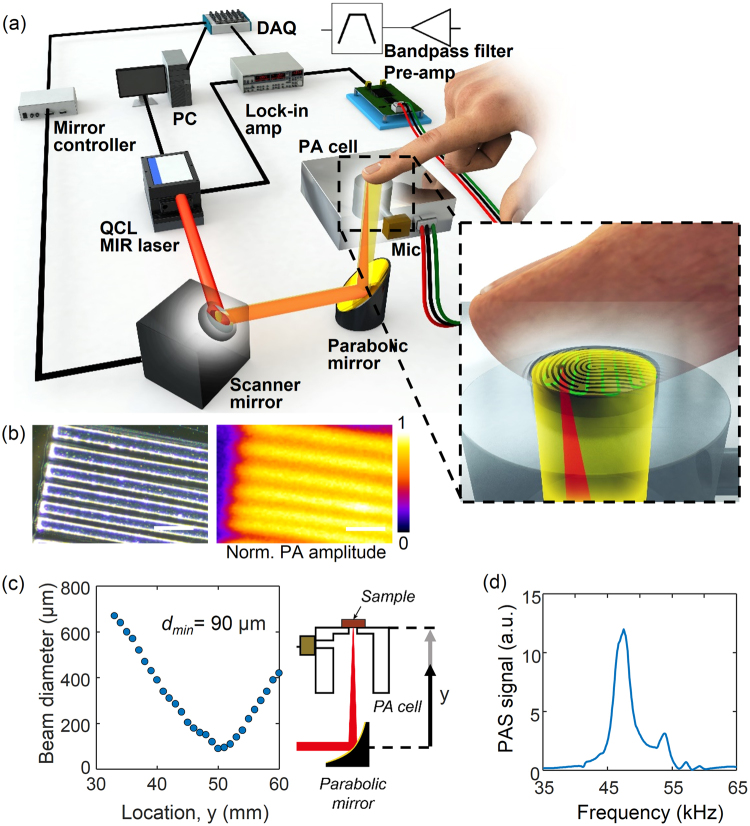
Figure 1.
(a) Schematic drawing of the position scanning photoacoustic spectroscopy system. (b) Optical micrograph and photoacoustic image of SU-8 structures for resolution evaluation. (c) Beam diameter after reflection from the parabolic mirror, with a minimum of 90 μm at the focal distance of 50.4 mm from the parabolic mirror. (d) Photoacoustic spectrum in the frequency domain where the peak is located at 47.5 kHz with a reference carbon black tape sample. Scale bar is 250 µm.

