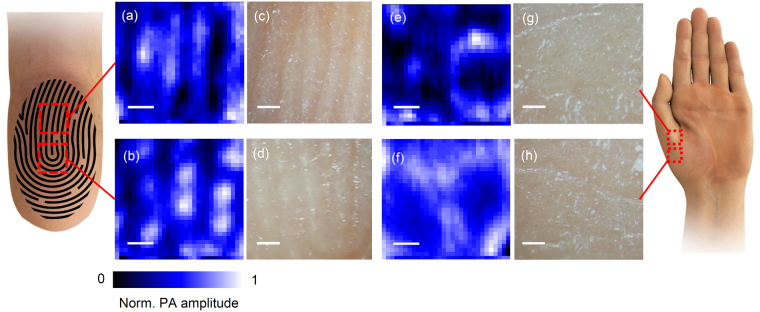
Figure 2.
Images of the position scanning photoacoustic spectroscopy measured in two different regions of the fingertip; the part of the epidermal ridges aligned in a line (a) and the part where the epidermal ridges are bent into the U-shape (b). The optical micrographs of the corresponding fingertip regions are shown in (c) and (d). Images of the position scanning photoacoustic spectroscopy measured in the volar thenar are shown in (e) and (f), with the corresponding optical micrographs in (g) and (h). Scale bar is 250 µm.

