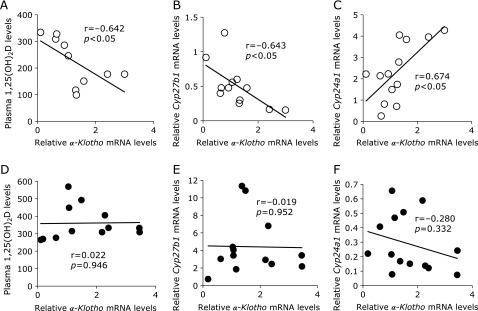
Fig. 4.
Correlation between renal α-Klotho mRNA expression and levels of plasma 1,25(OH)2D and FGF23/α-Klotho system target gene expression. 1, 2 and 13 month-old C57BL/6J mice were fed either a HP (◯) or LP (●) diet for 5 days. Correlation of renal α-Klotho mRNA levels with (A, D) plasma 1,25(OH)2D levels and renal (B,E) Cyp27b1, (C, F) Cyp24a1 mRNA levels in each diet group (n = 10–14).

