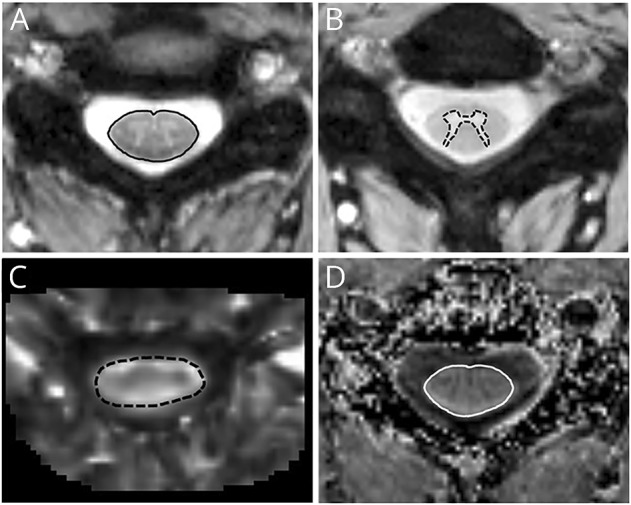
Figure 1. Quantitative spinal cord MRI maps and segmentations.

(A) Manual segmentation of the spinal cord cross-sectional area (black line) on high-resolution T2*-weighted, gradient-echo sequence with magnetization-transfer (MT) prepulse, (B) manual segmentation of spinal cord gray matter (black dashed line) on T2*-weighted, gradient-echo sequence without MT prepulse, (C) axial cross section of the map of fractional anisotropy with superimposed region of interest (black dashed line), and (D) axial cross section of the map of magnetization transfer ratio with superimposed region of interest (white line).
