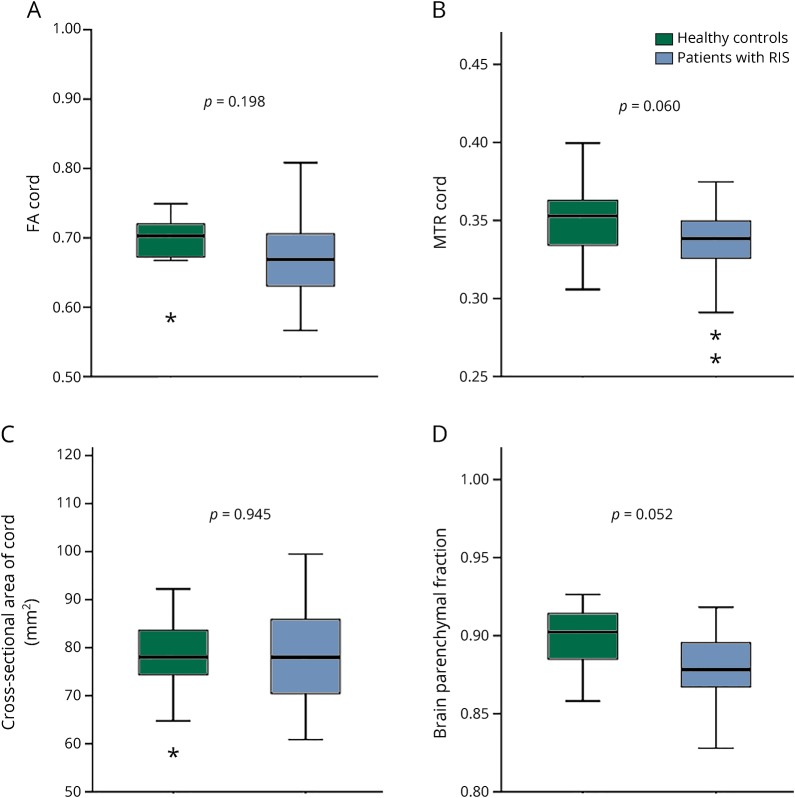
Figure 3. Comparisons of quantitative spinal cord MRI measures and brain atrophy in RIS vs. healthy controls (adjusted for age and sex).
(A) FA cord, (B) MTR code, (C) cross-sectional area of the cord, and (D) brain parenchymal fraction. *Boxplots depict median, interquartile range, and upper and lower fences of each MRI index. Asterisks represent outliers. FA = fractional anisotropy; MTR = magnetization transfer ratio; RIS = radiologically isolated syndrome.

