
Fig. 1.
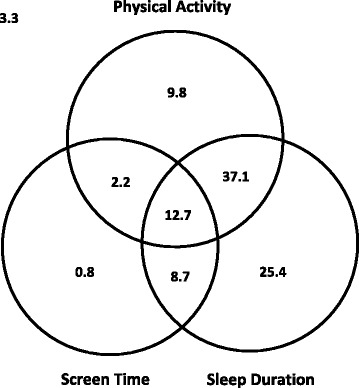
Title: Venn diagram showing the proportion (%) of participants meeting no recommendations; the physical activity, screen time, and sleep duration recommendations; and combinations of these recommendations, in the full study sample (n = 803)
Legend: The recommendations are: ≥180 min/day of physical activity (of which ≥60 min is moderate-to-vigorous physical activity), ≤1 h/day of screen time, and 10–13 h/day of sleep. The sum of each circle is equivalent to the % meeting each individual recommendation (i.e., 61.8% for physical activity, 83.9% for sleep duration, and 24.4% for screen time).