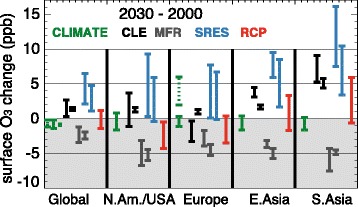
Fig. 2.

Reproduction (with permission) of Figure 11.22 from chapter 11, IPCC WG1 Fifth Assessment Report (Kirtman et al. [74]) showing changes in surface O3 (ppb) between year 2000 and 2030 driven by climate alone (CLIMATE; green) or emissions alone following CLE (black), MRF (gray), SRES (blue) and RCP (red) emission scenarios. Bars represents multi-model standard deviation with the exception of the green dotted bar over Europe, which represents the range of climate-only changes in summer daily maximum O3 from a single-model study [43]. For further details, see Kirtman et al. [74]
