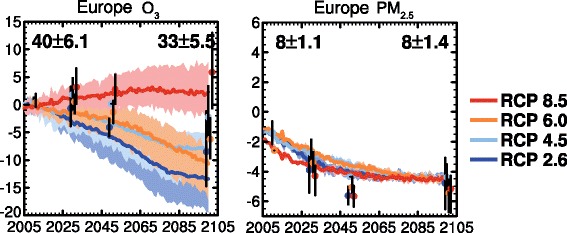
Fig. 3.

Adaptation (with permission) of Figures 11.23a and 11.23b from chapter 11, IPCC WG1 Fifth Assessment Report (Kirtman et al. [74]), showing European panels only. Projected changes in annual-mean (left) O3 (ppbv) and (right) PM2.5 (μg m−3) from 2000 to 2100 following the RCP scenarios (8.5 red, 6.0 orange, light blue 4.5, 2.6 dark blue) averaged over Europe (land). Coloured lines show the average and shading denotes the full range of 4 chemistry-climate models and coloured dots and vertical bars represent the average and full range of ~15 ACCMIP models for decadal time slices centred on 2010, 2030, 2050 and 2100. The average value and model standard deviation for the reference period is shown in the top of each panel for CMIP5 models (left) and ACCMIP models (right). For further details, see Kirtman et al. [74]
