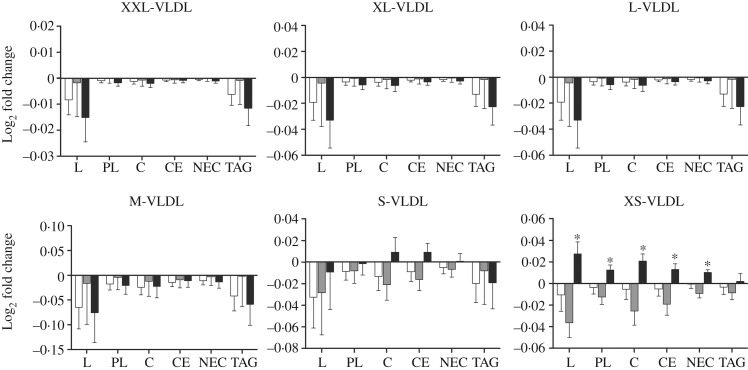
Fig. 4.
Log2-transformed fold change in VLDL subclasses for total lipids (L), phospholipids (PL), cholesterol (C), cholesteryl esters (CE), non-esterified cholesterol (NEC) and TAG: (a) extremely large VLDL (XXL-VLDL), (b) very large VLDL (XL-VLDL), (c) large VLDL (L-VLDL), (d) medium VLDL (M-VLDL), (e) small VLDL (S-VLDL) and (f) very small VLDL (XS-VLDL). (□), Fish group (n 11); (■), krill group (n 12); (▒), control group (n 12). Values are means, with standard errors represented by vertical bars. Overall significant differences in the changes were determined by one-way ANOVA. * P < 0·05.

