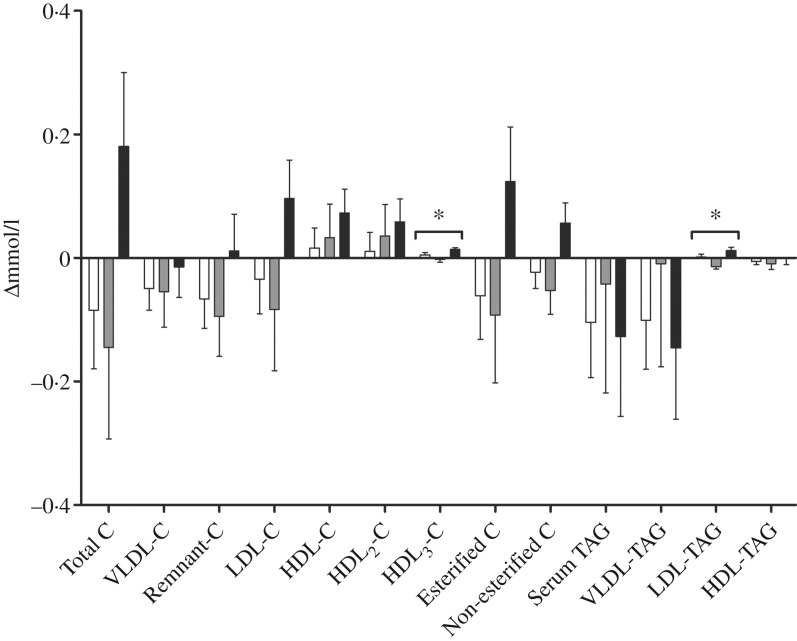
Fig. 5.
Change in fractions of TAG and cholesterol (C) measured with NMR spectroscopy in groups receiving either fish (□; n 11), krill oil (■; n 12) or control oil (▒; n 12). Values are means, with standard errors represented by vertical bars. Overall significant differences in the changes were determined by one-way ANOVA. * P < 0·05.

