
Figure 4.
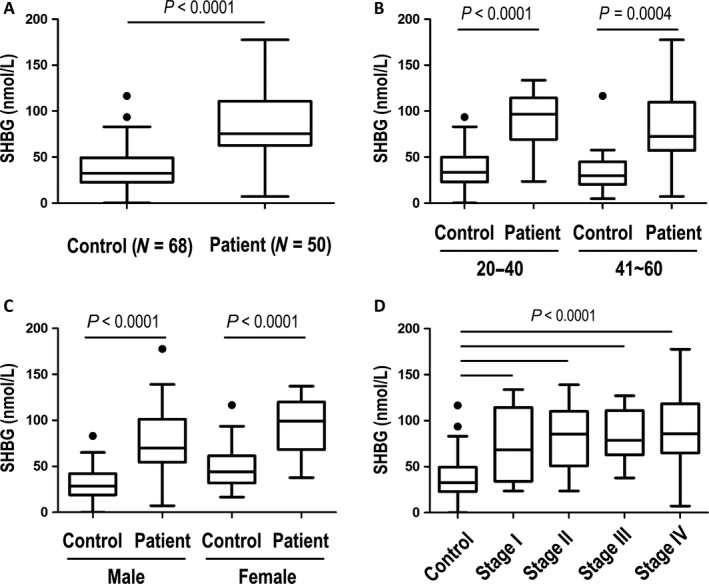
ELISA measurement results of plasma sex hormone‐binding globulin (SHBG) from the validation study cohort. ELISA results were compared between patients and healthy control subjects (A) and were stratified by age (B), gender (C), and disease stage (D). All panels are presented as box plots showing the median value (line), the interquartile range (box), and Tukey whiskers embracing data within 1.5‐fold of the interquartile range; all data outside the range of the Tukey whiskers are presented as individual data points.