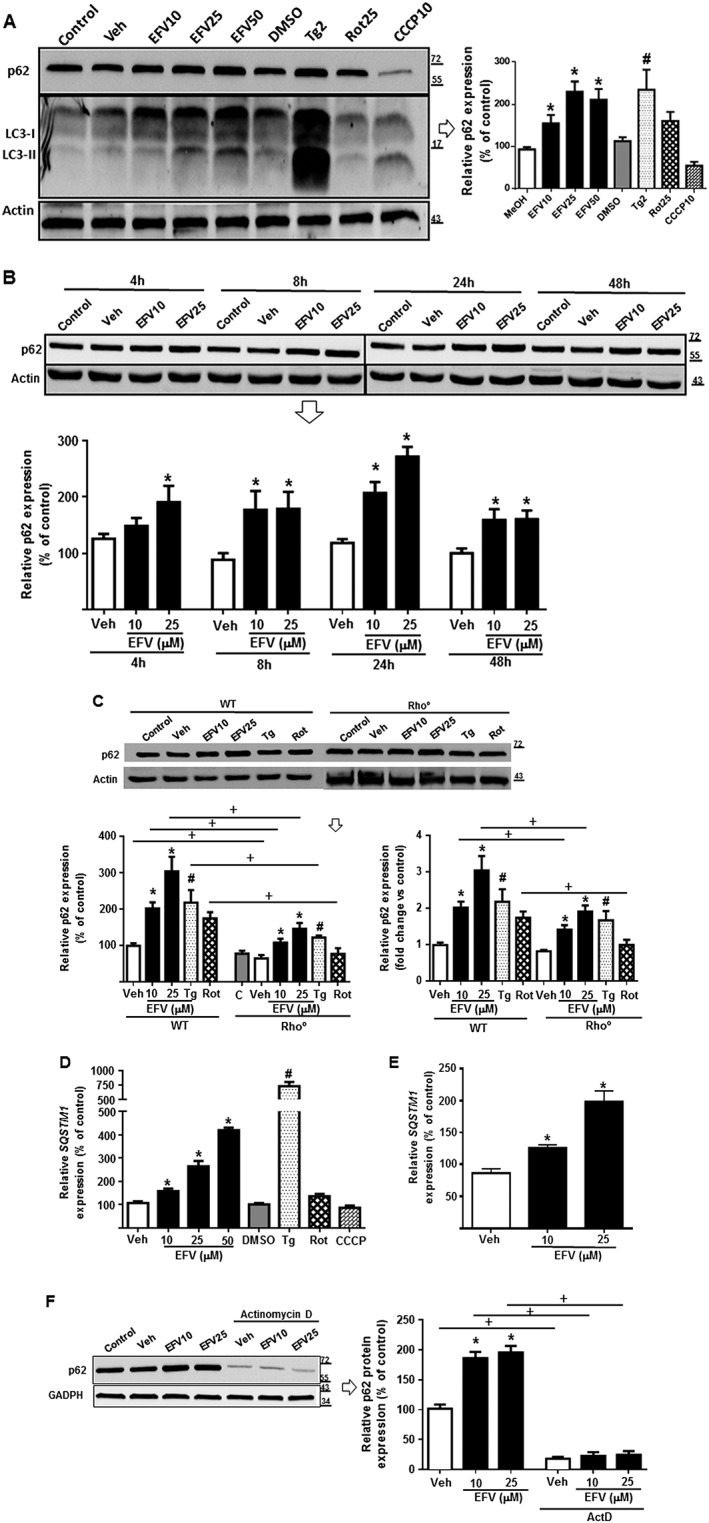
Figure 1.

p62 expression is increased at protein and mRNA level upon exposure to mitochondrial and ER stress stimuli. Cells were treated for 24 h (A, C, D, E and F) or 4, 8, 24 and 48 h (B) with increasing concentrations of efavirenz (EFV), vehicle (MeOH or DMSO), thapsigargin (Tg) 2 μM, rotenone (Rot) 25 μM or CCCP 10 μM. Data (mean ± SEM) are expressed as relative protein or mRNA content in relation to that of untreated cells (control, considered 100%) after normalization with expression of the housekeeping protein (β‐actin or GAPDH) or gene (ACTB). (A) Immunoblot analysis of total cell extracts showing a representative Western blot image and summary of densitometry data of p62 expression (n = 9 except for EFV50 and rotenone n = 8, CCCP, n = 7, thapsigargin, n = 6). (B) Time‐course immunoblot analysis of total cell extracts showing representative Western blot image and densitometry data expressing quantification of p62 protein levels at the indicated treatment times (n = 7). p62 expression in untreated cells (at all time points) was considered 100%. (C) Immunoblot analysis of total cell extracts showing representative Western blot image of p62 and summary of densitometry data in ρ+ and ρ° cells (n = 6). p62 expression in untreated wild‐type (ρ+) cells was considered 100% (left panel) while p62 expression in untreated (ρ+ and ρ°; shown as Rho) cells was considered 1 (right panel). (D) Relative mRNA expression levels of SQSTM1 in Hep3B cells (n = 8, except for DMSO, thapsigargin, rotenone and CCCP n = 5) and (E) human hepatocytes (n = 2) were analysed by quantitative RT‐PCR. Data were normalized versus the housekeeping gene β‐Actin (ACTB). (F) Immunoblot analysis of total cell extracts showing representative Western blot image of p62 and summary of densitometry data in cells co‐treated with efavirenz and actinomycin D (2 μg·mL−1) (an inhibitor of gene transcription) (n = 7 except for EFV10 and EFV25, n = 5). Data (mean ± SEM) were calculated as percentage of control (untreated cells). *P < 0.05 for efavirenz; #P < 0.05 for thapsigargin, rotenone, CCCP; significantly different from vehicle; one‐way ANOVA followed by a Newman–Keuls test. +P < 0.05, significantly different as indicated; Student's t‐test.
