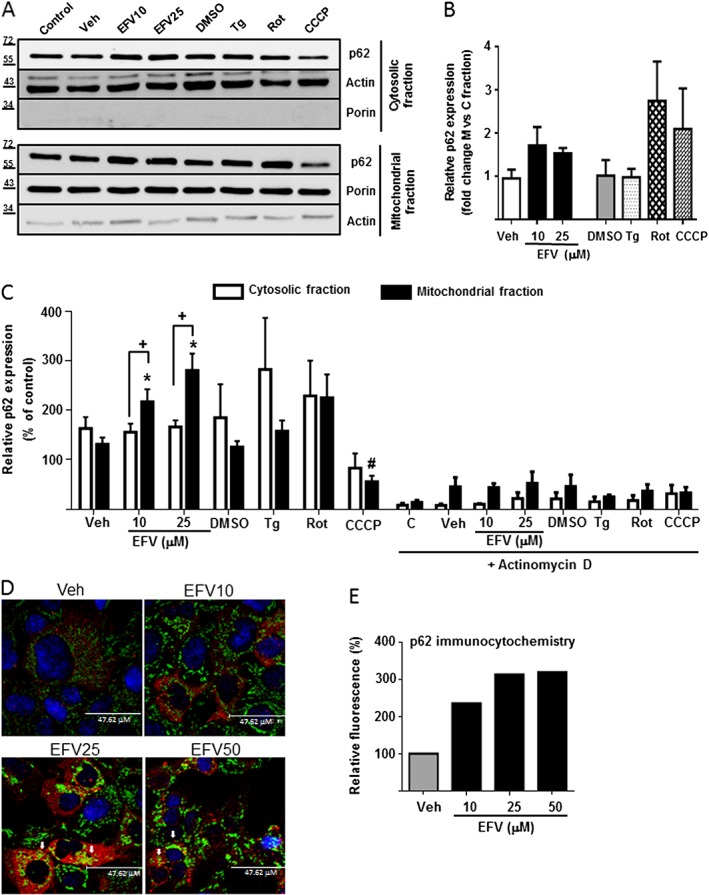
Figure 2.

Differential sub‐cellular expression of p62. Representative Western blot image (A) of p62 and summary of densitometry data (B, C) in mitochondria‐enriched and cytosolic extracts obtained from Hep3B cells treated with increasing concentrations of efavirenz (EFV), vehicle (MeOH or DMSO), thapsigargin (Tg) 2 μM, rotenone (Rot) 25 μM or CCCP 10 μM for 24 h in the presence or absence of 2 μg·mL−1 actinomycin D (n = 5). Equal amounts of protein (30 μg) from mitochondrial and cytosolic protein extracts were loaded. Actin and porin expression was assessed to ensure the purity of the extracts. Data (mean ± SEM) were calculated as percentage of control (untreated cells were considered 100% in both extracts). *P < 0.05, for efavirenz and #P < 0.05 for thapsigargin, rotenone or CCCP, significantly different from vehicle; one‐way ANOVA followed by a Newman–Keuls test. +P < 0.05, significantly different as indicated; two‐way ANOVA followed by a Sidak's test. (D) Representative confocal fluorescence microscopy images (63× 3.0 digital zoom) of cells treated with Veh or EFV (10, 25 or 50 μM) and immunostained for p62 (red) and mitochondria (TOM20, green). Nuclei were stained with the fluorochrome Hoechst (blue). Arrows show points of colocalization. (E) Quantification of the fluorescence signal of p62 expressed as %.
