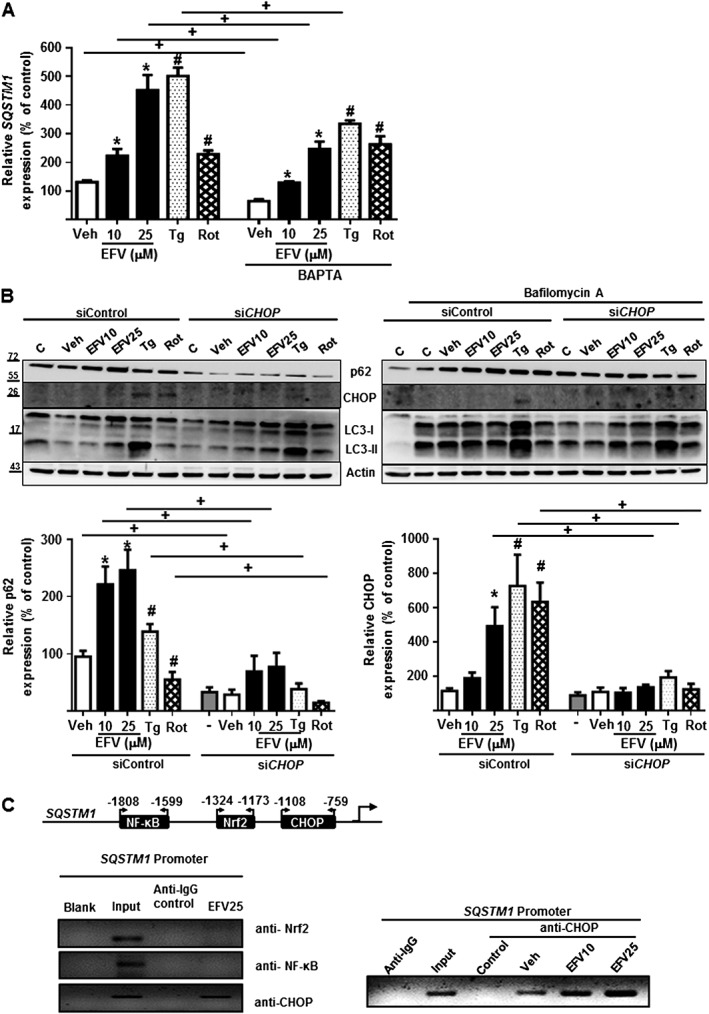
Figure 3.

p62 expression is calcium‐ and CHOP‐dependent. Hep3B cells were treated for 24 h with increasing concentrations of efavirenz (EFV), vehicle (MeOH), thapsigargin (Tg) 2 μM or rotenone (Rot) 25 μM in the presence or absence of the inhibitor of autophagy, bafilomycin A1 20 nM. (A) Relative mRNA expression levels of SQSTM1, in presence or absence of the Ca2+ chelator BAPTA‐AM (10 μM), was analysed by quantitative RT‐PCR. Data were normalized versus the housekeeping gene β‐Actin (ACTB) and SQSTM1 expression in untreated cell (without BAPTA‐AM) was considered 100% (mean ± SEM, n = 5). (B) Representative WB image of p62, LC3 and CHOP, and summary of densitometry data in cells transfected with siControl or siCHOP. Data (mean ± SEM, n = 5) were calculated as percentage of untreated siControl cells (considered 100%). *P < 0.05, for efavirenz and #P < 0.05 for thapsigargin, rotenone or CCCP, significantly different from vehicle; one‐way ANOVA followed by a Newman–Keuls test. +P < 0.05, significantly different as indicated; Student's t‐test. (C) CHOP is associated with SQSTM1 promoter in presence of efavirenz, but not with Nrf2 or NF‐κB. A representative image of PCR bands after chromatin immunoprecipitation (ChIP) assay performed in Hep3B cells treated with efavirenz (25 μM), where chromatin was immunoprecititated with anti‐Nrf2, anti‐NF‐κB or anti‐CHOP antibody and PCR assay was carried out to amplify the immunoprecipitated chromatin using primers flanking the binding site of Nrf2, NF‐κB or CHOP on the SQSTM1 promoter (left panel); representative image of ChIP assay showing SQSTM1 promoter occupancy by CHOP in Hep3B cells treated with vehicle and efavirenz (10 and 25 μM) (right panel). A non‐related antibody anti‐IgG and input control were employed as negative and positive controls respectively.
