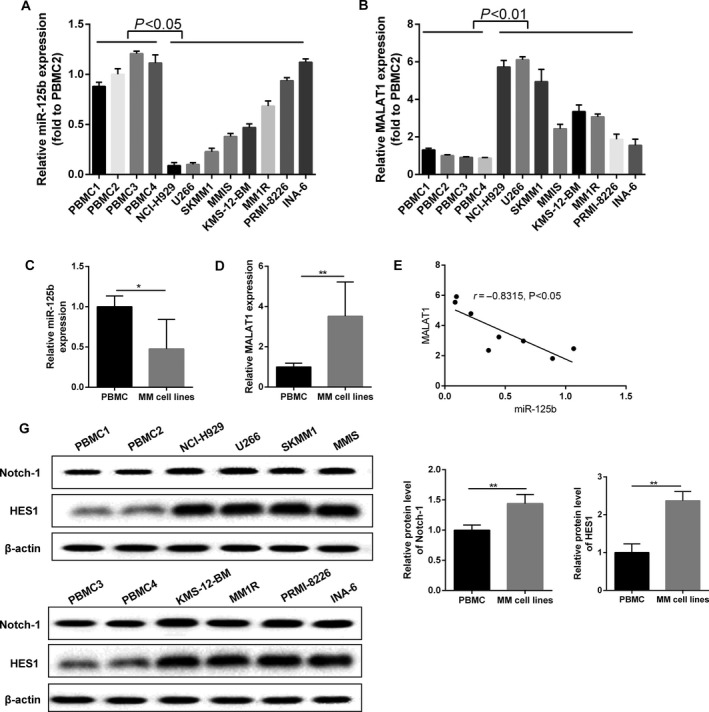
Figure 1.

The relationship between miR‐125b and MALAT1 in MM cells. (A) The expression of miR‐125b was assessed using qRT‐PCR method in MM cell lines and normal peripheral blood mononuclear cells. (B) MALAT1 expression was assessed using qRT‐PCR method in MM cell lines and normal peripheral blood mononuclear cells. (C) The expression level of miR‐125b was down‐regulated in MM cell lines compared with PBMC cell lines. (D) MALAT1 was up‐regulated in MM cell lines compared with PBMC cell lines. (E) Negative correlation existed between the expression of miR‐125b and MALAT1. (F) Notch1 and HES1 protein was detected by western blot method. (G) Histograms of quantification protein concentration. Data are exhibited as mean ± SD. In qRT‐PCR, U6 and GAPDH served as controls, respectively. In western blot, β‐actin acted as internal reference. *P < 0.05, **P < 0.01 compared with controls.
