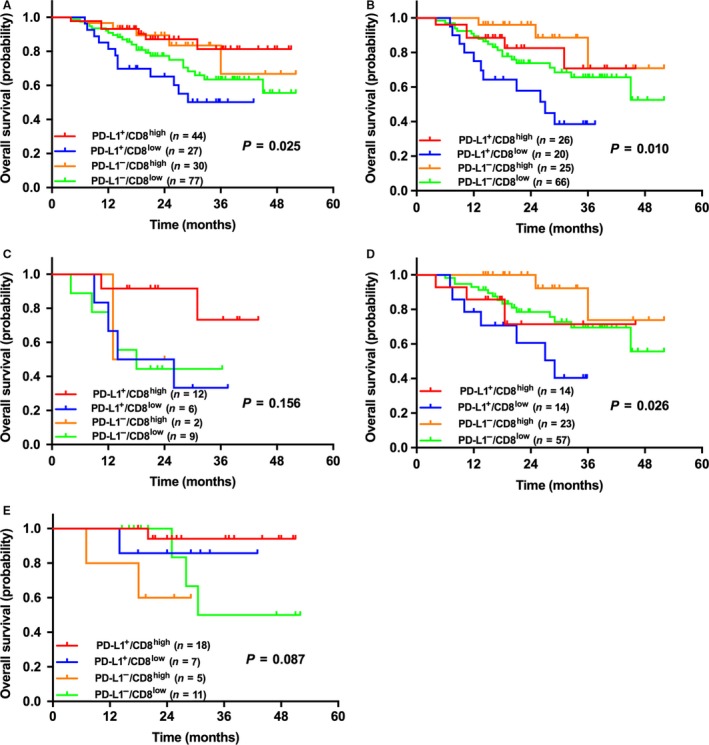
Figure 3.

Kaplan–Meier survival curves of patients with NSCLC (A), ADC (B), solid ADC (C), non‐solid ADC (D), and SqCC (E) sub‐grouped by the combination of PD‐L1 expression (5% cut‐off) and CD8+ TILs density (5% cut‐off). Significant statistical differences were shown in patients with NSCLC, ADC and non‐solid ADC (P = 0.025, 0.010 & 0.026, respectively). In patients with ADC and non‐solid ADC, patients with PD‐L1–/CD8high had the longest OS, and PD‐L1+/CD8low had the shortest OS. However, among the whole NSCLC patients, patients with PD‐L1+/CD8high had the longest OS, and PD‐L1–/CD8low had the shortest OS. No statistical differences were shown in patients with solid ADC and SqCC.
