
Figure 1.
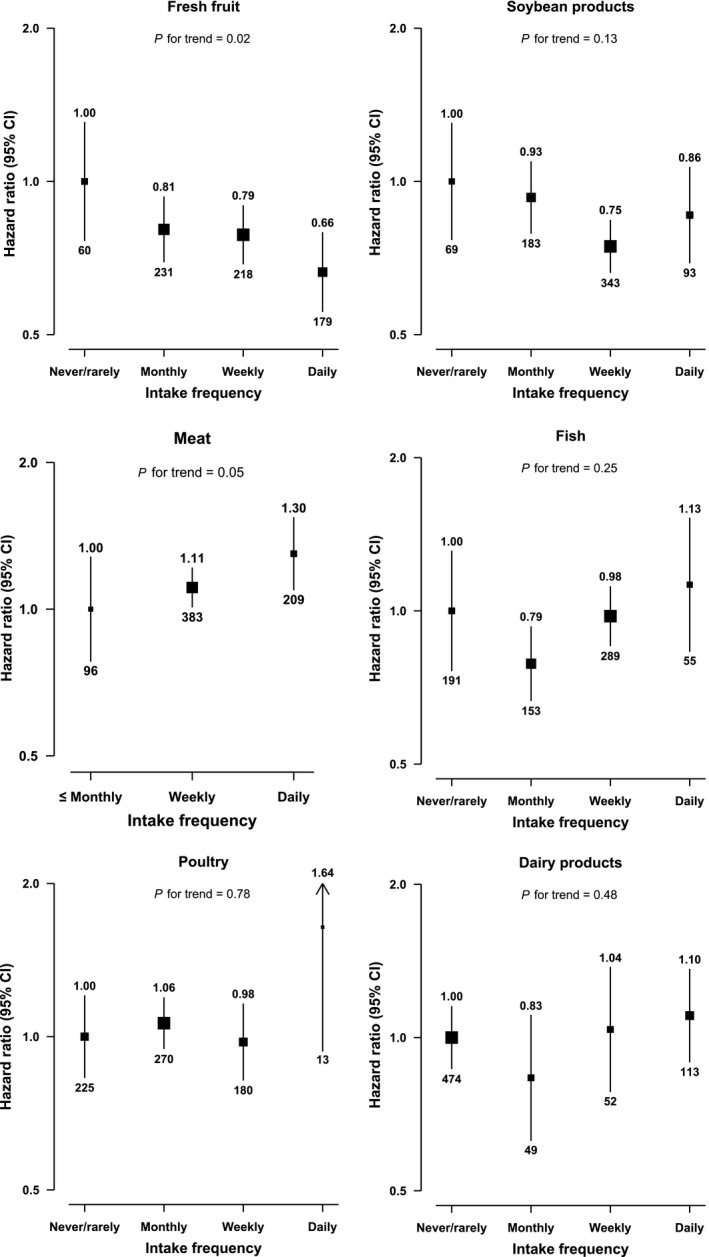
Adjusted HRs for PC by self‐reported intake frequency of dietary fraction. Intake frequency was classified as never/rarely (reference), monthly, weekly (1–3 days/week), and daily or almost daily (≥4 days/week and daily). The boxes represent hazard ratios and the vertical lines represent 95% confidence intervals. The sizes of the boxes are proportional to the inverse of the variance of the log hazard ratios. The numbers above the vertical lines are point estimates for hazard ratios, and the numbers below the lines are numbers of events. The models were stratified by age‐at‐risk, sex and study area, and adjusted for education, smoking, alcohol, BMI, and total physical activity.