
Figure 6.
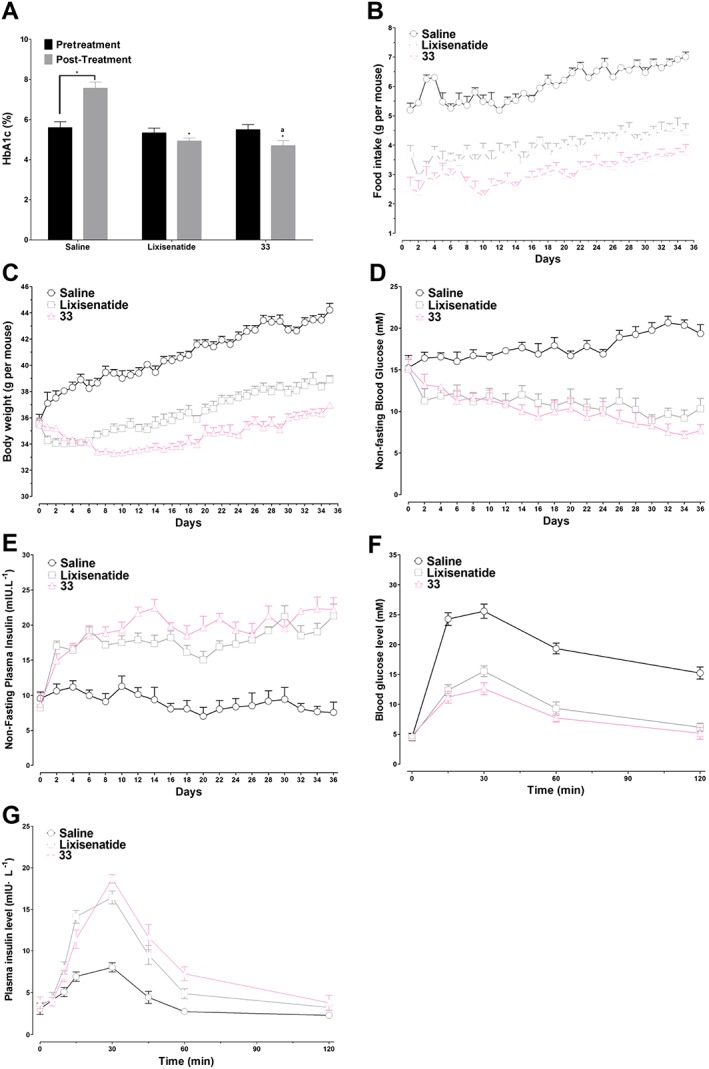
Effects of long‐term treatment, for 35 days, with 33 or lixisenatide on db/db mice. (A) HbA1c (%) values on day 0 compared with on day 36. * P < 0.05 versus control, a P < 0.05 versus lixisenatide. (B) Food intake. (C) Body weight change. (D) Non‐fasting blood glucose levels. (E) Non‐fasting plasma insulin levels. (F) The time course of blood glucose levels in each group in IPGTT test on day 37. (G) The time course of plasma insulin levels in each group in IPGTT test on day 37. Results are presented as means ± SD, n = 6.