
Figure 7.
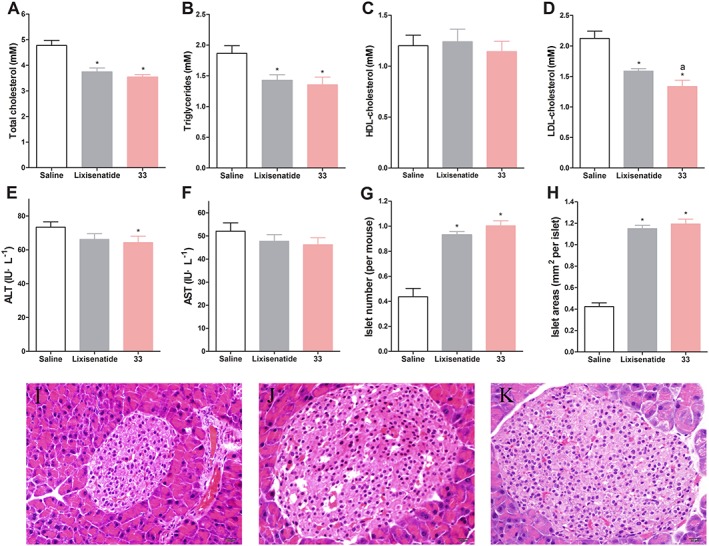
Biochemical analysis and histological examination of each group of db/db mice following the 5 week treatment. (A) Total cholesterol. (B) Triglyceride. (C) HDL cholesterol. (D) LDL cholesterol. (E) ALT. (F) AST. (G) Number of pancreatic islets. (H) Area of pancreatic islets. Representative images of HE staining (I) saline (control), (J) lixisenatide and (K) 33 histological samples. Results are presented as means ± SD, n = 6. * P < 0.05 versus control, a P < 0.05 versus lixisenatide.