
Figure 2.
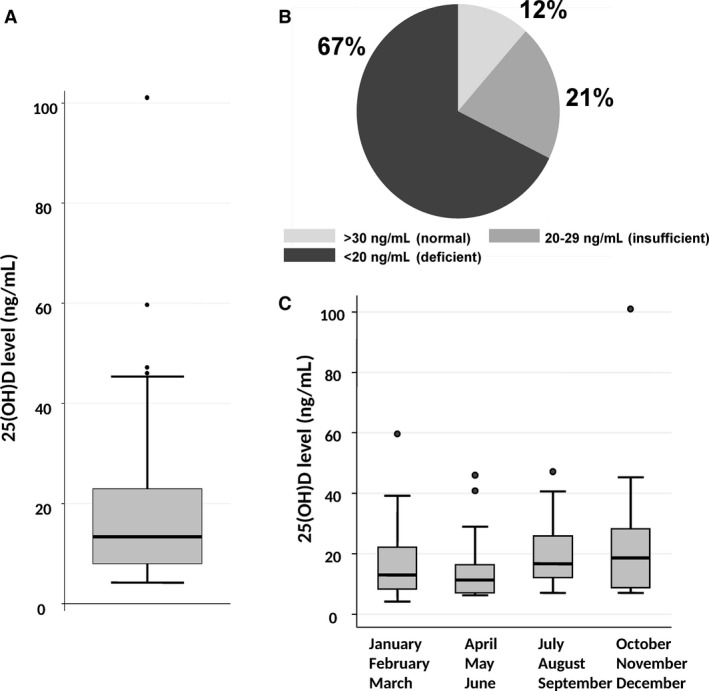
25(OH)D levels in 155 patients with aggressive B‐cell lymphomas. (A) Box‐plot of 25(OH)D levels. The upper border of the box indicates the upper quartile (75th percentile) while the lower border indicates the lower quartile (25th percentile), and the horizontal line in the box the median. The vertical lines are the whiskers indicating the upper and lower adjacent values. (B) Distribution of patients according to 25(OH)D levels considered to be normal (≥30 ng/mL), insufficient (20–29 ng/mL), or deficient (<20 ng/mL). C) Seasonal variation in 25(OH)D levels were significantly lower in the period from April to June (P < 0.001).