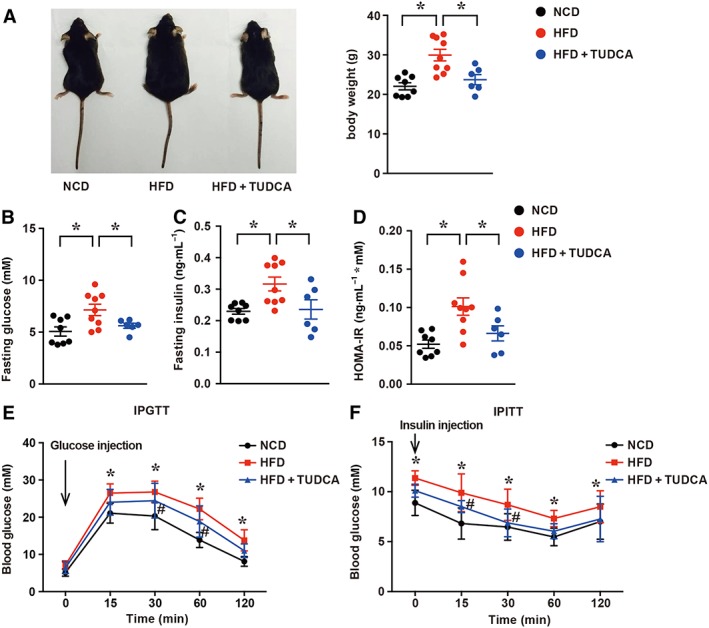
Figure 2.

TUDCA ameliorates HFD‐induced obesity and insulin resistance in NAFLD mice. (A, left) Representative macroscopic pictures and (A, right) body weight of the NCD, HFD and HFD + TUDCA groups. (B) Fasting glucose, (C) fasting insulin and (D) HOMA‐IR in mice treated with NCD, HFD or HFD + TUDCA. Fasting glucose and fasting insulin levels were measured at the endpoint of this experiment. HOMA‐IR was calculated as HOMA‐IR = (FBG (mM) × FINS (ng·mL−1))/22.5. (E) The IPGTT and (F) IPITT assays were performed to evaluate the insulin sensitivity of mice in the indicated groups treated with NCD, HFD or HFD + TUDCA. The data are presented as the mean ± SEM for (A–D) and mean ± SD for (E–F). One‐way ANOVA followed by Newman–Keuls post hoc test for multiple comparison. NCD group, n = 8; HFD group, n = 9; and HFD + TUDCA, n = 6. *P < 0.05 versus the NCD group; # P < 0.05 versus the HFD group.
