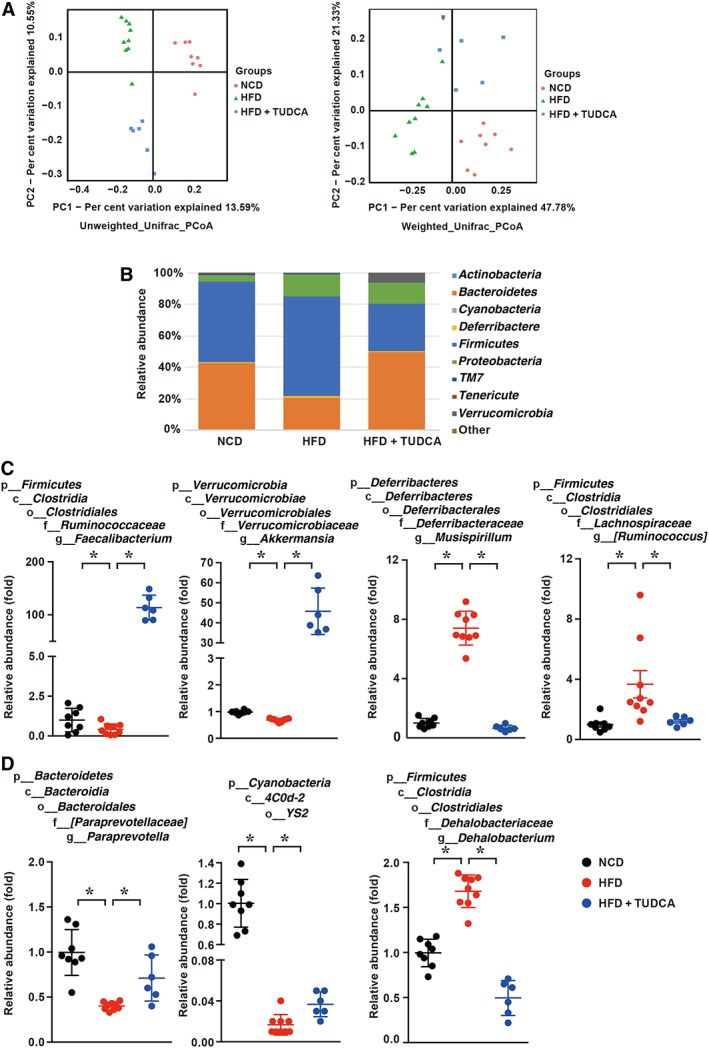
Figure 6.

TUDCA treated mice show different gut microbiota composition compared with HFD‐fed mice. (A) PCoA score plot; PCoA score plot based on unweighted (left panel) and weighted (right panel) UniFrac metrics; (B) average phylum distribution of gut microbiomes in the NCD, HFD and HFD + TUDCA groups; and (C, D) comparison of the taxonomic abundance among the indicated groups. The data are presented as the means ± SEM. The statistical significance in bacterial composition among the different samples was assessed by the ANOSIM test. NCD group, n = 8; HFD group, n = 9; and HFD + TUDCA, n = 6. *P < 0.05.
