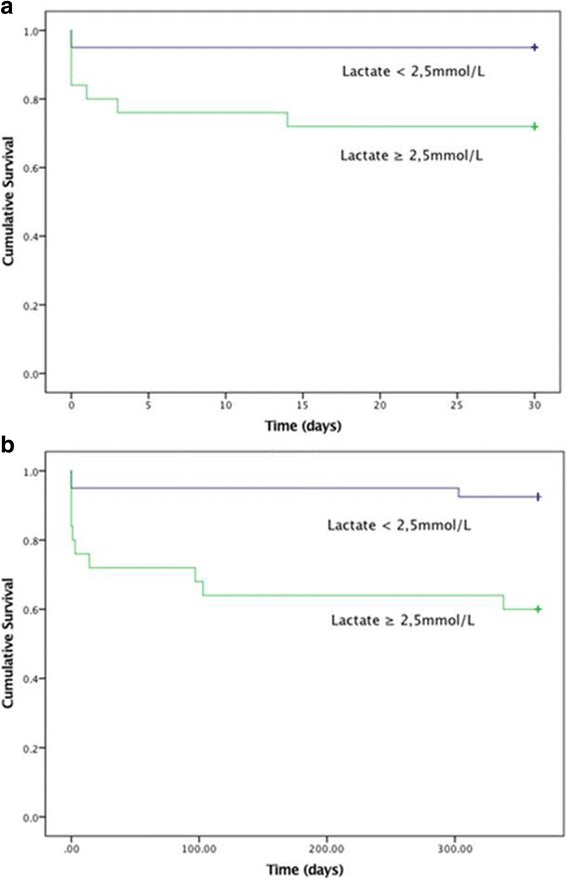
Fig. 3.

a Kaplan-Meier curve showing 30-day mortality in patients presenting in Killip class II-III with and without elevated lactate defined as blood lactate ≥2.5 mmol/L. b Kaplan-Meier curve: 1-year mortality in patients presenting in Killip class II-III with and without elevated lactate defined as blood lactate ≥2.5 mmol/L
