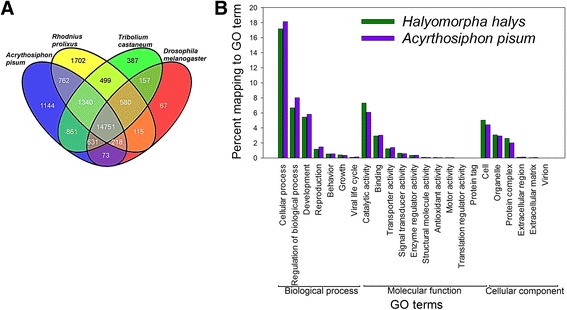
Fig. 3.

Comparative genomics for Halyomorpha halys transcriptome. a Venn diagram showing the number of transcript contigs with significant matches (unique and common) to genomes of A. pisum, D. melanogaster, R. prolixus, and T. castaneum. Significant matches (e value <1.0E-3) were calculated after pairwise comparisons (blastx) to each individual genome. b Comparison of GO term mappings distributions of H. halys and A. pisum that belong to each of the three top-level GO categories (i.e. biological process, molecular function, and cellular component)
