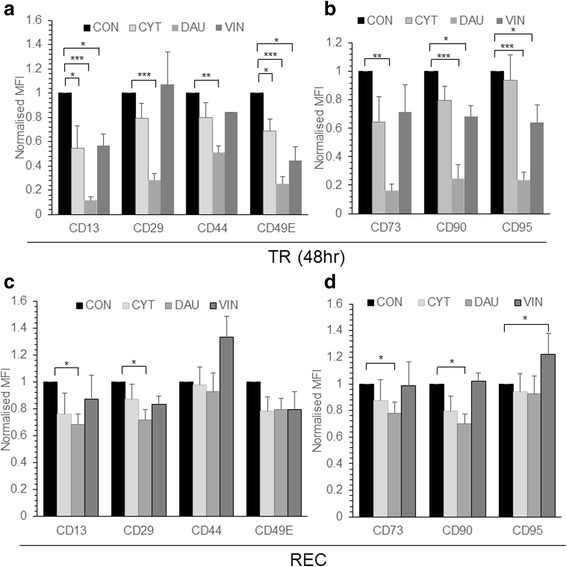
Fig. 2.

Phenotype of drug treated MSC. MSC were treated with CYT (10μM), DAU (0.1μM) and VIN (0.1μM) for 48 h. a, b Expression of indicated cell surface markers after CYT, DAU, VIN treatment or in control (CON) untreated cells was analyzed by flow cytometry (TR). c, d Drug treated and control MSC were allowed to recover in drug free media for 7 days (REC) and the cell surface marker expression was analyzed. MFI represents mean fluorescent intensity of the markers analyzed and it is normalized to their respective isotype controls. Values are mean ± SE, n = 3–5 samples. *p < 0.05, **p < 0.005, ***p < 0.0005
