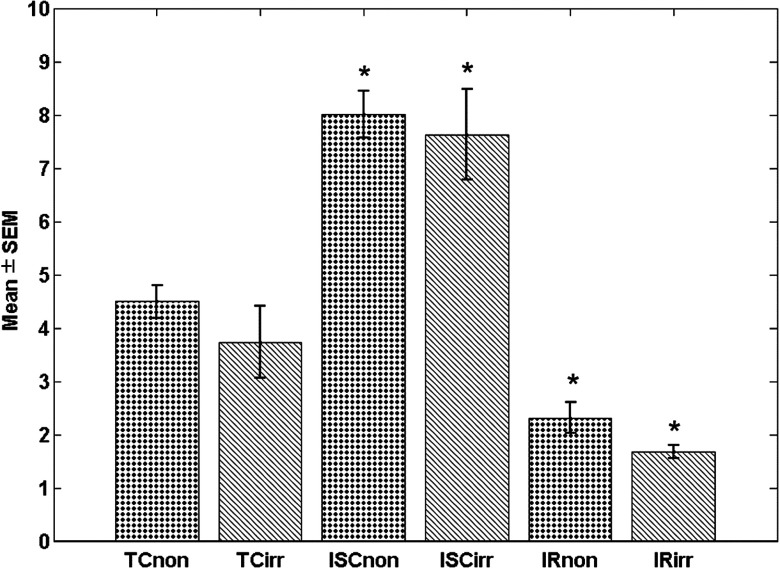
Fig. 5.
Bar plot of for volumetric histograms showing statistical analysis (). * shows the group that are significantly different from their respective TCs. Significant difference is observed between different treatments, but not intergroup, i.e., nonirradiated versus irradiated samples with same treatment.

