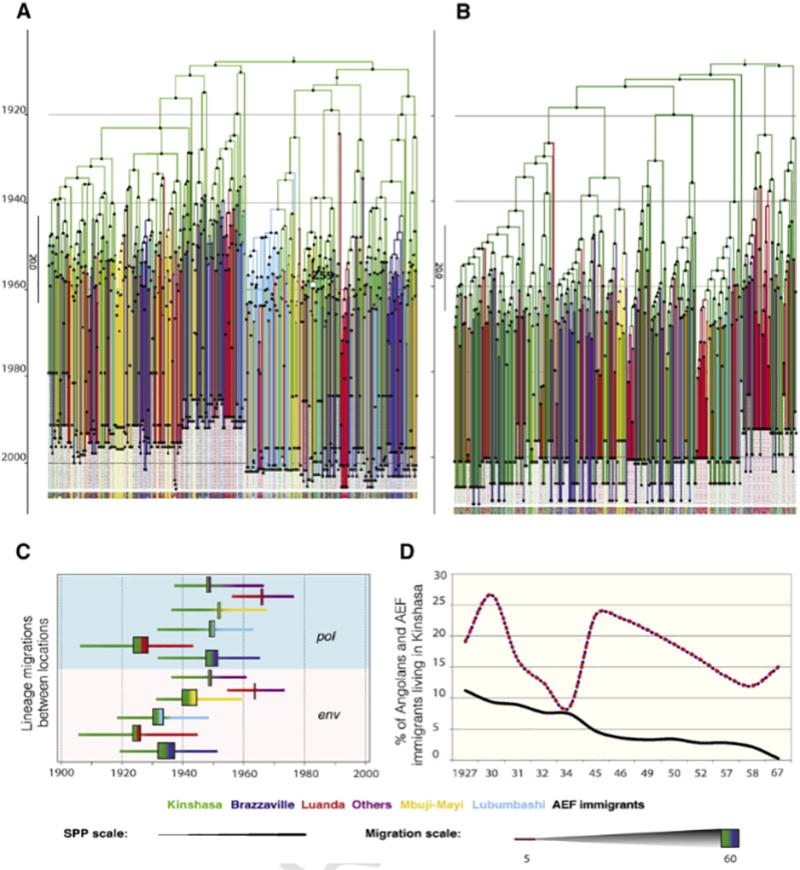
Figure 1. Phylogeographic analysis of the early spread of HIV-1.

The MCC trees of the C2V3 (A) and pol (B) datasets are shown. The most likely location of the parental node is represented with colors that are explained in the lower panel. The oldest sequence available sampled in DRC in 1959 is represented with a square (ZR59). The C2V3 and pol datasets included the following number of sequences per location (C2V3/pol): Angola: Cabinda (12/19), Cuanza Norte (1/1), Luanda (78/82), Lunda Norte (2/2), Malanje (2/8), Zaire province (2/2); Democratic Republic of Congo: Bwamanda (33/1), Kimpese (0/1), Kinshasa (97/142), Kisangani (23/8), Likasi (24/0), Lubumbashi (76/20), Mbuji-Mayi (96/18); Congo: Brazzaville (97/50), Pointe Noire (21/0). Regions of Angola with low number of sequences such as Cabinda, Cuanza Norte, Malanje, Lunda Norte, and Zaire were grouped into ‘Others’. The posterior probability (PP) > 0.7 is pictured as a circle in the nodes, the color and the size reflects the scale of this probability. (C) The earliest dates of significant lineage migrations in DRC, RC and Angola in env C2V3 and pol are represented by colors as indicated. The rectangle represents the mean of the earliest introduction from the exporter (left) to the importer (right) according to the direction of the migration, whereas the horizontal size of the rectangle is proportional to the number of migrations in each transition. Lines represent the Bayesian Credible intervals. (D) The percentage of Angolans (mainly from the North region, red and violet line) and people from Afrique Équatoriale Française (AEF, black line) living in Leopoldville/Kinshasa according to different censuses of the population (Affaires Indigènes et Main d’Oeuvre (AIMO), 1927; Comissariat de Police de Léopoldville, 1931; Congo Belge, 1930, 1932, 1934, 1949, 1957; Institut National de la Statistique, 1969; Service d'Administration de la Population Noire, 1945, 1946, 1950, 1952; Spitaels, 1959).
