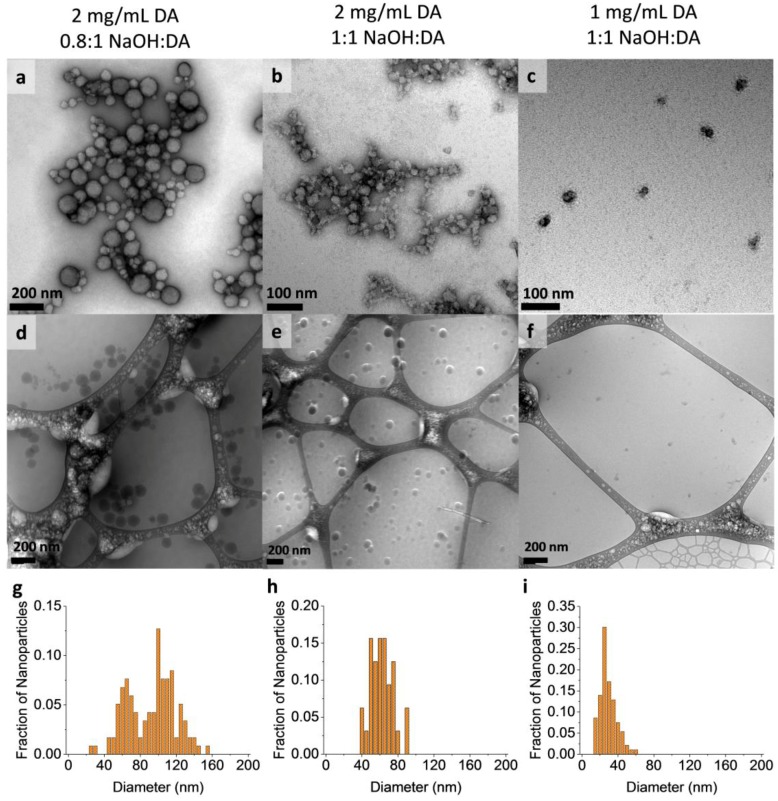
Figure 3.
Transmission electron microscopy (TEM) images of MMNPs and quantitative analysis of nanoparticle diameter grown at the conditions specified at the top of each column. (a–c) TEM images with uranyl acetate negative stain. (d–f) Cryo-TEM images were taken without staining. Nanoparticles are spherical but have rougher appearances as diameter decreases. (g–i) Distribution of MMNP diameters in cryo-TEM images.

