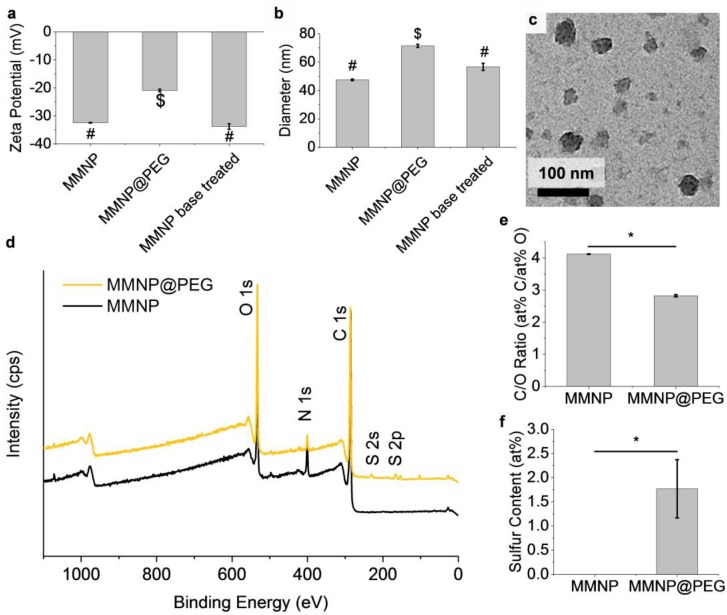
Figure 4.
MMNP@PEG vs. MMNP zeta potential, hydrodynamic diameter, morphology, and atomic composition. (a) Zeta potentials and (b) hydrodynamic diameters of MMNPs, MMNP@PEG, and control MMNPs treated with 10 mM NaOH base. Samples not sharing symbols are significantly different (p < 0.05). (c) TEM image of MMNP@PEG. (d) XPS survey scans of MMNP and MMNP@PEG with assignments for O 1s, N 1s, C 1s, and S 2s, and S 2p peaks. (e) C/O atomic ratios in MMNP vs. MMNP@PEG calculated from C 1s and O 1s signal ratios (* p < 0.01). at%: Atomic percent relative to total C, N, O, and S content. (f) Sulfur content in MMNP vs. MMNP@PEG calculated from S 2p signal intensity expressed as at% S (* p < 0.01). Error bars represent standard errors.

