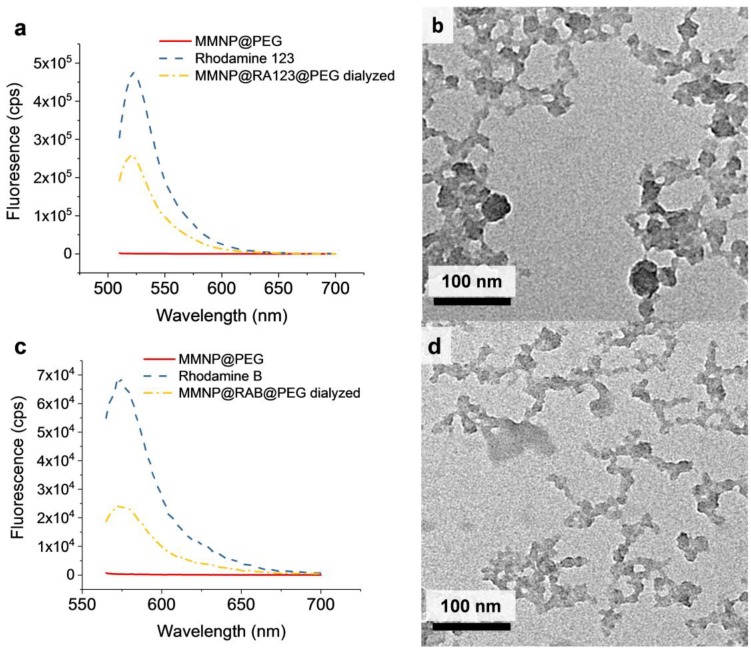
Figure 6.
Fluorescence emission spectra and TEM images of in situ labeled MMNP@RA123 and MMNP@RAB. (a) Fluorescent emission spectra (λex = 500 nm) of MMNP@RA123@PEG after seven day dialysis in 1× phosphate-buffered saline (PBS), rhodamine 123, and MMNP@PEG. (b) TEM image of MMNP@RAB. (c) Fluorescent emission spectra (λex = 555 nm) of MMNP@RAB@PEG after seven day dialysis in 1× PBS, rhodamine B, and MMNP@PEG. (d) TEM image of MMNP@RA123.

