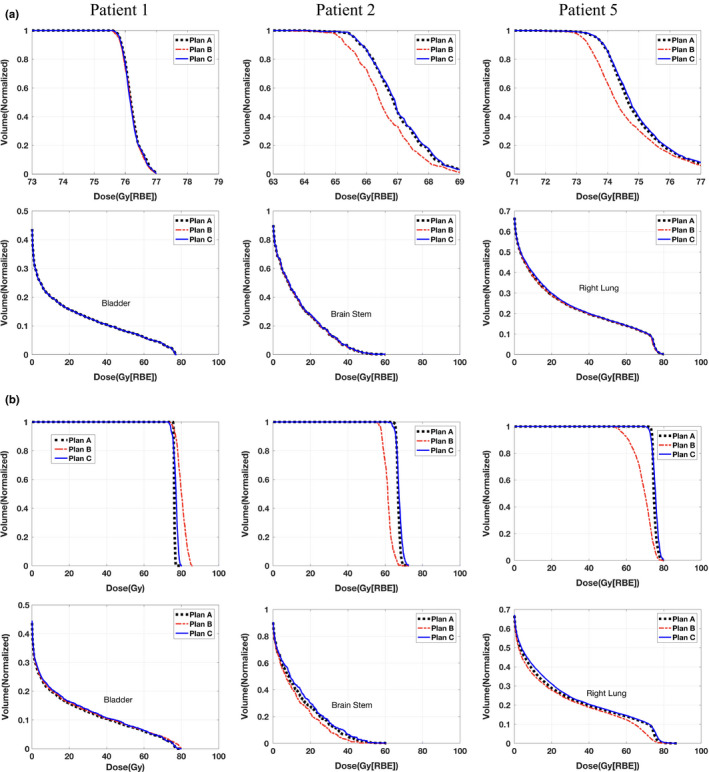
Figure 2.

Dose–volume histograms (DVHs) for all three methods in patient 1 with prostate cancer (first column), patient 2 with head–neck cancer (second column), and patient 5 with lung cancer (third column). The first row indicates DVHs for CTVs; the second row indicates DVHs for organ at risk. Part (a) is the test with realistic minimum MU constraint and part (b) is with artificially large (10 times larger than that in part (a)) minimum MU constraint. Please note that figures in the top row are zoomed in. [Color figure can be viewed at wileyonlinelibrary.com]
