Figure 1.
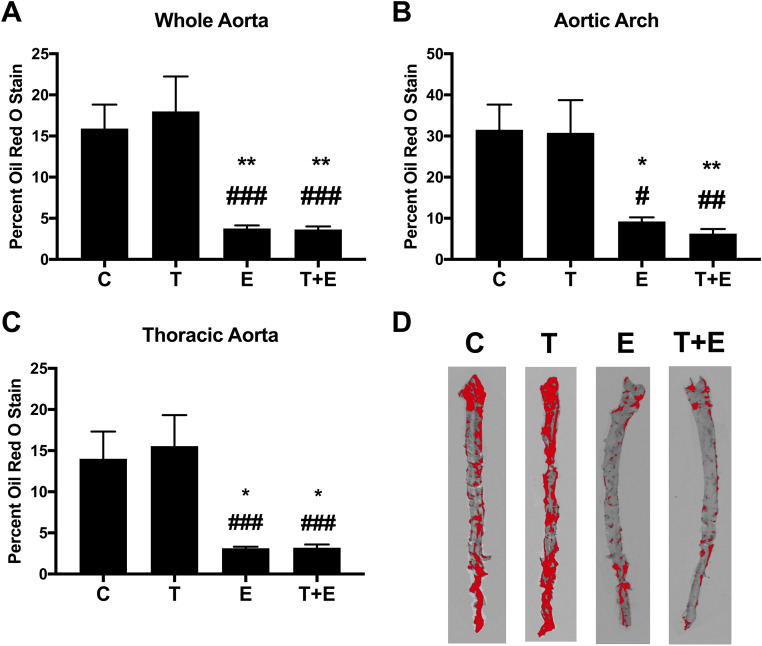
Quantification of aorta ORO stain. Percent stained area is shown for (A) whole aorta, (B) aortic arch, and (C) thoracic aorta (vehicle control: n = 5; T, E, and T+E: n = 6 per group). Data are presented as mean ± SEM. There was a significant relationship between treatment and ORO staining for the whole aorta (F = 9.07, P = 0.006), aortic arch (F = 7.36, P = 0.002), and thoracic aorta (F = 7.67, P = 0.0015). Post hoc Tukey-corrected tests demonstrated that the E and T+E groups had significantly less lesion formation than mice treated with vehicle or with T alone, for whole aorta, aortic arch, and thoracic aorta. No other comparisons were significantly different. Significance compared with vehicle controls: *P = 0.03, **P = 0.02. Significance compared with T: #P = 0.03, ##P = 0.02, ###P < 0.01. (D) A representative aorta for each group with red quantification on ImageJ is shown.

