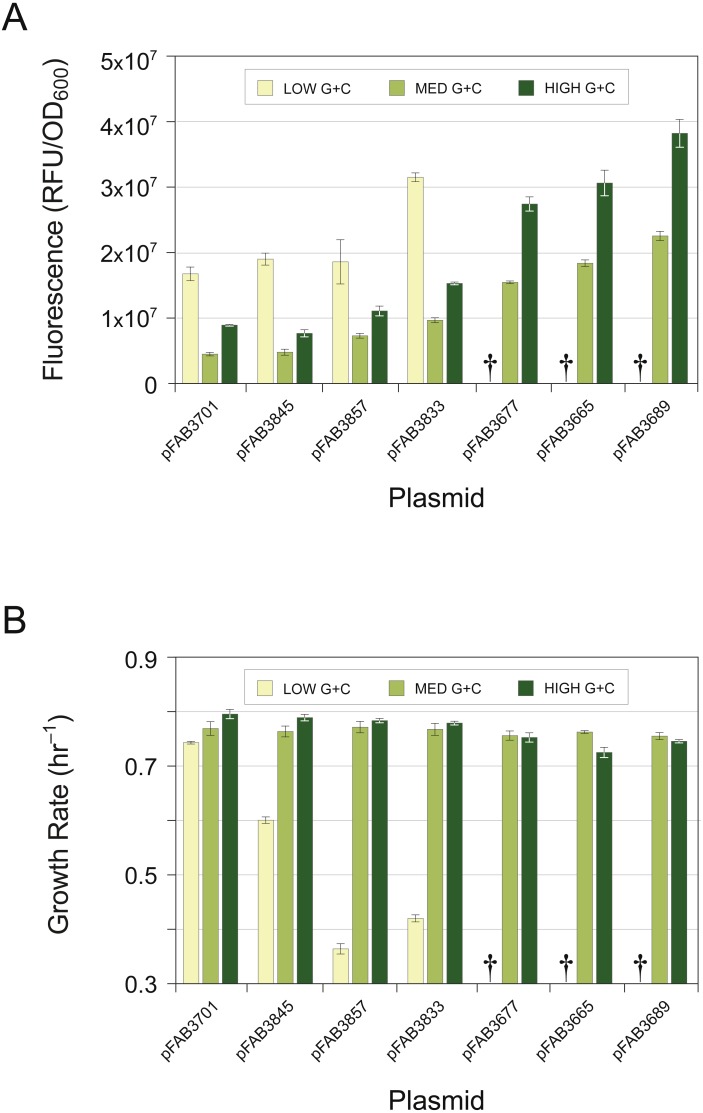
Figure 1. Effects of promoter strength and base composition on expression level and cellular growth rate.
GFP genes were recoded at synonymous sites to possess a consistently low (yellow; 41%), medium (light green; 50%) or high (dark green; 59%) G + C content over the entire gene. (A) GFP constructs of different G + C contents tested for expression levels in multiple pFAB vectors, displayed in order of increasing promoter strength. Expression levels determined by intensity of cell fluorescence. Daggers (†) denote constructs refractory to cloning, all of which were of low G + C contents. (B) Fitness measurements of strains expressing GFP constructs from (A) determined by exponential-phase growth rates. Daggers (†) denote constructs not assayed. Bars represent the mean ± standard deviation of three biological replicates.

