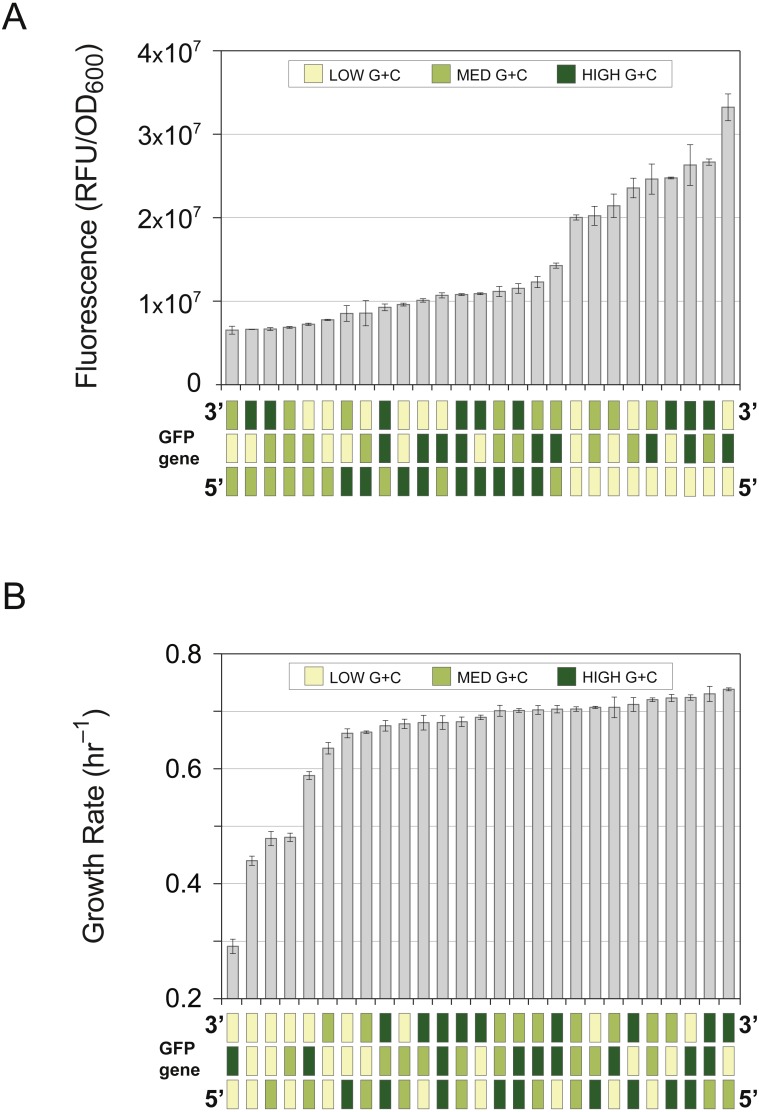
Figure 2. Gene expression and cellular growth rate of compositional mosaics.
Recoded GFP genes (as shown in Fig. 1) were each subdivided into three fragments and shuffled to create all 27 possible full-length gene combinations. Each of the shuffled GFP genes encodes the identical protein sequence, and all constructs were cloned and expressed in the pFAB3857 vector. Gene diagrams on the x-axis show the mosaic structure of each of the tested genes, shaded according to the GC-content of each fragment: yellow; 41% G + C; light green; 50% G + C; dark green; 59% G + C. (A) Gene expression levels of mosaics GFP genes determined by intensity of cell fluorescence, with constructs arranged in order of increasing expression. Bars represent the mean ± standard deviation of three biological replicates. (B) Growth rates of E. coli strains expressing mosaic GFP genes. Fitness measurements the 27 GFP variants determined by exponential-phase growth rate, with constructs arranged in order of increasing growth rates. Bars represent the mean ± standard deviation of three biological replicates.

